Abstract
Kunihiko Kaneko’s papers of 1982–1998 traced how ordered dynamics lose order: phase locking, torus oscillation, doubling and fractalization, symmetry breaking, three-frequency motion, spatiotemporal intermittency, and collective chaos in globally coupled maps. This review recomputes figures from those papers with the open-source package dynachaos and arranges the models in six steps, from phase locking to mean-field coupling. Each figure names the command that regenerates it. Parameter scans use up to values. Four modern diagnostics—the 0-1 test, SALI, permutation entropy, and recurrence quantification analysis—are examined alongside classical measures; on the dissipative coupled delayed logistic map, SALI stays bounded on orbits with two zero Lyapunov exponents and decays on partial locking and on chaos, so its decay alone does not separate those two. The review adds no new route to chaos and no new diagnostic; the torus-doubling exponent is quoted from Kaneko, not remeasured, and whether the spatiotemporal intermittency of the lattices shown here belongs to the directed-percolation class, as measured in circle-map lattices and in experiment, is not tested. Preprint, not peer reviewed.
1 Introduction #
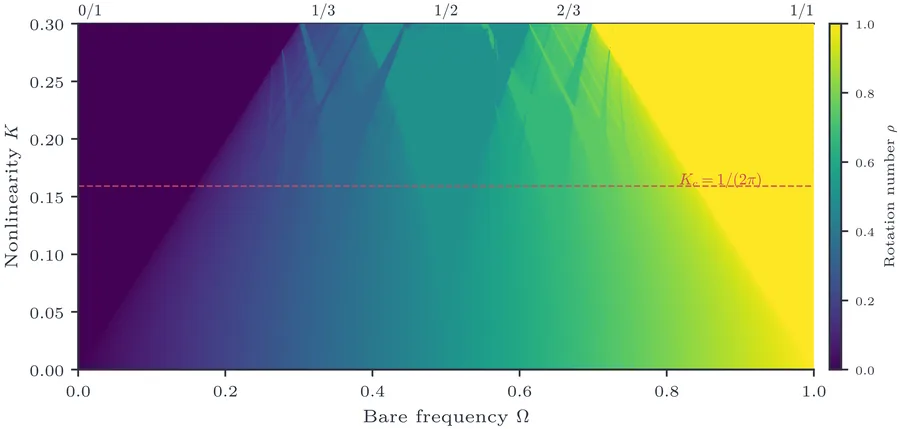
The question that runs through Kunihiko Kaneko’s papers from 1982 to 1998 is how a smooth, ordered system becomes turbulent. Consider a system driven by two independent rhythms. When the ratio of their frequencies is a simple fraction, the rhythms lock and the system repeats periodically. Stronger driving widens the locking intervals into wedge-shaped Arnold tongues in the parameter plane. Between the locked states the system winds quasi-periodically on a smooth ring, a torus.
Increase the nonlinearity further and the torus has three possible fates before chaos: it can oscillate (the ring develops wiggles along its length), double (the ring splits into two nested rings, then four, then eight, as in period doubling), or fractalize (the smooth ring crumples at every scale into a wrinkled invariant set prior to the onset of positive Lyapunov exponents). Chaos, an attractor with a positive Lyapunov exponent, comes only past a critical threshold.
On a spatial lattice of coupled chaotic maps, three collective phenomena appear that no single map shows: spatiotemporal intermittency, in which laminar and turbulent patches coexist and move; pattern dynamics, in which the lattice selects spatial patterns that then compete through defect turbulence; and collective chaos, in which the mean field of a globally coupled system has its own low-dimensional chaotic dynamics and the law of large numbers fails.
Kaneko worked through this whole sequence, from locking to collective chaos, in papers published between 1982 and 1998 (Kaneko 1982, 1984c, 1983c, 1984a, 1985, 1990b, 1989b, 1992b), alongside parallel work on circle-map universality (Jensen et al. 1983; Feigenbaum et al. 1982), coupled-oscillator lattices (Waller and Kapral 1984), and the directed-percolation picture of spatiotemporal intermittency (Pomeau 1986; Chaté and Manneville 1988a).
Four equations cover all of the phenomena above. The circle map
Sections 2–7 develop these systems in the order of the physical mechanism, not the order of publication: phase instability, amplitude instability, symmetry breaking, high-dimensional extension, spatial extension, and mean-field coupling. Four modern diagnostics, introduced with references below, appear as “diagnostic spotlights” at the end of the mechanism chapters, instead of in a separate methods section.
Two things have changed since these papers were written: available resolution and the diagnostic toolkit. Kaneko’s parameter scans had of order points (for instance, the 100-point scan in Fig. 1 of (Kaneko 1982)) and his time series – iterations. The devil’s staircase here has 200 000 parameter values and each Lyapunov sweep of the coupled delayed map 500. The four diagnostic spotlights date from after or late within that period: recurrence plots (Eckmann et al., 1987 (Eckmann et al. 1987); Marwan et al., 2007 (Marwan et al. 2007)), the alignment index SALI (Skokos, 2001 (Skokos 2001); Skokos et al., 2007 (Skokos et al. 2007)), permutation entropy (Bandt and Pompe, 2002 (Bandt and Pompe 2002)), and the 0-1 test for chaos (Gottwald and Melbourne, 2004, 2009 (Gottwald and Melbourne 2004, 2009)). Yamagishi and Kaneko (2020) showed chaos on a high-dimensional torus instead of through its collapse, large surveys now score CML behaviour with statistical metrics (Nolan et al. 2026), and the clustering ideas continue in biological and ecological models (Kaneko 1994b, 1997a), most recently in a preprint by Shimada and Kaneko (2026).
This review provides a reproducible atlas across the full model progression. While Kaneko synthesized portions of this work in monographs and reviews (including his 1986 monograph Collapse of Tori and Genesis of Chaos in Dissipative Systems (Kaneko 1986a), surveys of spatiotemporal chaos and pattern dynamics (Kaneko 1989b, 1989c, 1992b), the 1993 edited volume Theory and Applications of Coupled Map Lattices, and the book with Tsuda, Complex Systems: Chaos and Beyond (Kaneko and Tsuda 2001)), those treatments used disparate notations across papers, relied on coarse parameter scans ( points), and lacked open, automated reproduction scripts. Here, every figure is tied to a single reproducible command in the companion package dynachaos, parameter scans are recomputed at high density (up to values) so that fine structures can be inspected directly, modern diagnostics are evaluated side by side on identical orbits, and all models are unified under a single consistent notation (Table 1).
Figure 1 summarises the arc of Kaneko’s research programme.
- 1982Circle mapphase locking
- 1983–84Torus instabilitiesoscillation, doubling
- 1983Coupled mapssymmetry breaking
- 1985CMLspatial extension
- 1989–90GCMmean-field
- 1994–98Milnor / biologyapplications
Convention: tori in maps versus flows #
Throughout this paper, we work exclusively with discrete maps (not flows). A quasi-periodic orbit of a 2D map lies on an invariant circle (topologically ). More generally, a -frequency quasi-periodic motion in a continuous-time flow lies on a -torus ; its Poincaré return map reduces the torus dimension by one to an invariant -torus , because the section removes the neutral direction along the flow. When we say “three-torus” we follow Kaneko’s usage (referring to three-frequency motion in the underlying flow), understanding that the corresponding map carries an invariant with two zero Lyapunov exponents, rather than the three zero exponents of the continuous-time flow.
Notation #
| Symbol | Meaning | Type | Sections |
|---|---|---|---|
| Circle map nonlinearity (sine amplitude) | Parameter | 2, 6 | |
| Bare rotation frequency (circle map) | Parameter | 2, 6 | |
| Logistic nonlinearity () | Parameter | 4, 5, 6, 7 | |
| Delay mixing weight (convex parameter) | Parameter | 3, 5 | |
| Drive amplitude (delayed logistic) | Parameter | 3 | |
| , | Drive parameters (coupled delayed logistic; Kaneko’s , ) | Parameter | 5 |
| Coupling strength (diffusive or global) | Parameter | 4, 5, 6, 7 | |
| Nonlinearity strength (modulated circle map) | Parameter | 5 | |
| Irrational modulation frequency | Parameter | 5 | |
| Recurrence threshold (RQA) | Parameter | 6 | |
| Local map function | Function | 1, 4, 6, 7 | |
| Coupling function (CML) | Function | 1, 6 | |
| Macroscopic mean field () | Observable | 7 | |
| Number of elements or lattice sites | Parameter | 6, 7 | |
| Discrete time (iteration step) | Variable | Throughout | |
| Element or lattice site index | Index | 6, 7 | |
| Rotation number | Observable | 2, 5 | |
| -th Lyapunov exponent () | Observable | Throughout | |
| Correlation dimension (Grassberger–Procaccia) | Observable | 3 | |
| Permutation entropy (normalised) | Observable | 5 | |
| Jensen–Shannon statistical complexity | Observable | 5 | |
| 0-1 test statistic | Observable | 4 |
Mechanistic atlas #
Table 2 lists the eight model systems of the atlas under the six mechanisms of the Introduction: rows 2a and 2b are the two faces of amplitude instability, rows 5a and 5b the two regimes of spatial coupling. Each row identifies the mechanism, the canonical model, the state-space dimension, the control parameters (in the notation of this paper), the attractor types encountered, and the Lyapunov signature.
| # | Mechanism | Model | Dim | Parameters | Attractor types | Diagnostic signature |
|---|---|---|---|---|---|---|
| 1 | Phase instability | Circle map | 1 | Fixed pts, inv. circle | (smooth); (chaos) | |
| 2a | Amplitude instability | Delayed logistic | 2 | Torus, doubled, fractal | ||
| 2b | Amplitude instability | Map (I), Map (IV) | 3, 4 | , chaos | Multiple | |
| 3 | Symmetry breaking | Coupled logistic | 2 | Torus, broken torus | , | |
| 4 | High-dimensional ext. | Coupled delayed | 4 | , lockings, chaos | Two zero exponents | |
| 5a | Spatial extension | CML (logistic) | Laminar/burst coexist | Spatiotemporal intermittency | ||
| 5b | Spatial extension | CML (logistic) | 5 phases | Frozen turbulent | ||
| 6 | Mean-field extension | GCM (logistic) | Clusters, mean-field chaos | LLN violation |
Computational defaults #
Unless stated otherwise: a transient is discarded before measurement; exact transient and sampling lengths are specified in each figure caption. Lyapunov exponents are computed via QR/Gram–Schmidt re-orthonormalization (Benettin algorithm (Benettin et al. 1980)); rotation numbers via the lift (unwrapped phase). Any computation using random initial conditions uses fixed seed np.random.default_rng(42). Figure artifacts are generated by dynachaos, the companion package used for this study (see App. B). Source code: https://github.com/openfluids/dynachaos.
How to reproduce the figures #
Figures are generated by a section-indexed pipeline in the companion dynachaos package, installed from PyPI:
pip install dynachaos
dynachaos list
dynachaos run sec02_circle_map
dynachaos run all
Generated figure graphics and caching artifacts are produced directly by each section runner; for exact figure-by-figure parameters (grid sizes, transient lengths, averaging lengths), see App. B.
The same codebase also provides the config-driven analysis pathway used for stand-alone scalar or reduced time-series diagnostics:
dynachaos analyze workflow_fixture.jsoncA workflow config names the input signal, output directory, diagnostics, and dense RQA scale limits; the stable outputs are workflow_output/results.json, workflow_output/metadata.json, and workflow_output/summary.md, resolved relative to the config file. Thus analysis products can be traced by config path, command, and result file rather than by private one-off scripts.
Glossary #
Definitions of key terms used throughout the paper.
- Arnold tongue
A wedge-shaped region in the two-parameter plane of a periodically forced oscillator within which the oscillator frequency locks to a rational multiple of the driving frequency. Named after V. I. Arnol’d.
- Collective chaos
Chaotic dynamics of the macroscopic mean field in a system of many coupled elements, with no sign of decay up to (as tested here).
- Devil’s staircase
A monotone function (typically rotation number versus a parameter) consisting of infinitely many rational plateaus (lockings) interspersed with a Cantor set of irrational values.
- Directed percolation (DP)
A non-equilibrium phase transition universality class describing the spreading of an “active” state into an “absorbing” state on a lattice.
- Farey tree
A hierarchical organisation of rational numbers in which the mediant of two fractions and appears between them.
- Frequency locking
Synchronisation of an oscillator to a rational frequency ratio with an external drive or a coupled partner; the quasi-periodic orbit degenerates into a periodic one.
- Lyapunov exponent
The rate of exponential divergence (or convergence) of nearby trajectories. Positive: chaos. Zero: quasi-periodic (marginal) direction. Negative: stable direction.
- Neimark–Sacker bifurcation
The discrete-map analogue of a Hopf bifurcation: a fixed point loses stability and an invariant closed curve (torus) is born.
- Rotation number
The average angle advanced per iteration on a circle map or invariant circle, .
- Strange nonchaotic attractor (SNA)
An attractor with fractal geometry (non-integer dimension) but no positive Lyapunov exponent: geometrically strange, dynamically regular.
2 Phase Instability: Locking and Staircases #
Phase locking transforms continuous quasi-periodic winding into resonant periodic steps, forming a devil’s staircase whose mode-locked plateaus attain full Lebesgue measure at criticality. Kaneko’s 1982 paper (Kaneko 1982) studied period adding in the circle map, and a second paper (Kaneko 1983b) worked out the self-similar scaling of the same sequence. The setting is a single oscillator under a periodic force, and the variable is the drive amplitude: the circle map has no spatial extent, no amplitude dynamics, and no coupling, so only the phase-locking mechanism is left. Kaneko’s computations traced the devil’s staircase and its period-adding sequences, ordered by the Farey tree, in this one-dimensional map. Jensen et al. (1983) and Feigenbaum et al. (1982) analysed the same structure at the same time; Kaneko’s part was the self-similar scaling of the period-adding sequence. We revisit his scan from Fig. 1 of (Kaneko 1982) with 200 000 parameter values, where his scan had of the order of a hundred, and add a rotation-number staircase and the Lyapunov exponent.
2.1 Circle map and Arnold tongues #
The circle map is defined by
Figure 2 shows the full tongue structure computed on a grid in the plane. Each tongue emanates from a rational at and widens as increases, with the width proportional to for small (Arnol’d 1961). The dominant tongues , , , , and are visible; between them, the Farey-mediant tongues , , nest self-similarly. Below the critical line , the map is a diffeomorphism of the circle and tongues do not overlap: between any two tongues lies a gap of quasi-periodic (irrational ) motion. Above , tongues overlap, the map ceases to be invertible, and chaotic dynamics are commonly observed in the overlap regions.
How this figure was computed
# Reduced preview (grid 10 x 5). Full figure: dynachaos run sec02_circle_map
import numpy as np

from dynachaos.maps.circle_map import rotation_number


def is_locked(r: float, max_denom: int = 5, tol: float = 1e-2) -> bool:
    return any(abs(r - p / q) < tol for q in range(1, max_denom + 1) for p in range(q + 1))


Omega_values = np.linspace(0.0, 1.0, 10)
K_values = np.linspace(0.0, 0.3, 5)

for K in K_values:
    row = [rotation_number(K, D=Omega, n_transient=200, n_iter=1000) for Omega in Omega_values]
    locked = sum(is_locked(r) for r in row)
    print(f"K={K:.2f}  locked points (q<=5): {locked}/{len(Omega_values)}")
2.2 Devil’s staircase and period-adding #
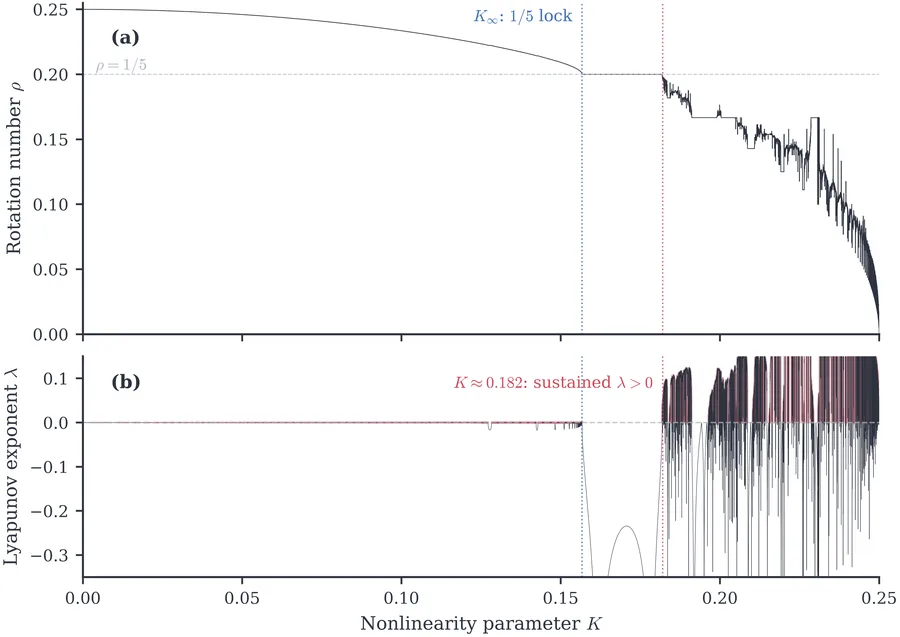
Kaneko (1982) studied the circle map (1) at fixed rotation frequency and swept the nonlinearity . The resulting plot (Figure 3): within the pre-chaotic regime (), is a nonincreasing function with broad rational plateaus (the frequency lockings) separated by quasi-periodic intervals. Although the standard “complete devil’s staircase” is more often plotted as at fixed critical , Kaneko’s scan isolates the same Farey-locking mechanism along a physically important one-parameter path.
Between any two rational plateaus and lies another plateau at the Farey mediant . This nesting repeats at every scale, which makes the staircase a fractal and is why it is called a devil’s staircase. At the noninvertibility threshold , mode-locked plateaus cover full Lebesgue measure; the complement is a Cantor set of measure zero (Jensen et al. 1983, 1984). Below , the quasi-periodic windows have positive measure; above it, they shrink to zero. Kaneko (1984e) analysed the supercritical behaviour () of disordered orbits in detail. The universality of this transition was analysed independently by Feigenbaum et al. (1982) and by Rand et al. (Rand et al. 1982) and Ostlund et al. (Ostlund et al. 1983).
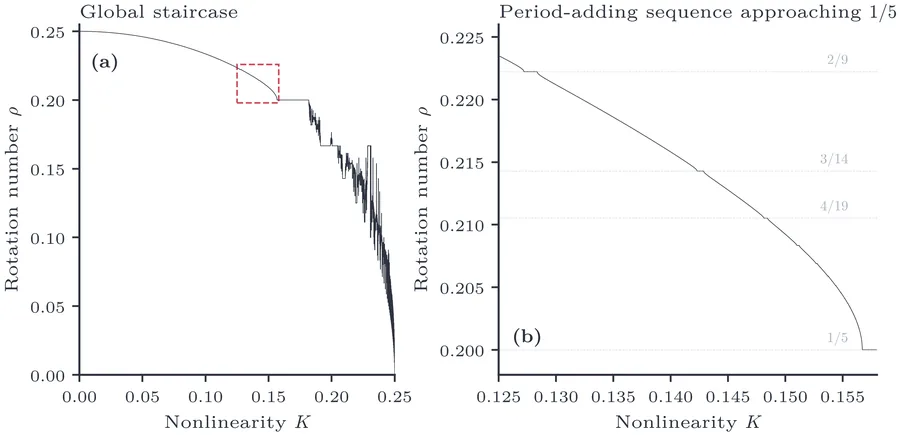
For the specific scan at , the dominant accumulation is the locking. Starting from at (), the staircase passes through the period-adding sequence , , , , with general term (Kaneko 1982, 1983b), before the plateau opens fully. The sequence accumulates at , determined here by bisection (dynachaos run sec02_circle_map) on the lift locking condition after transient iterates as the parameter where the boundary of the locking tongue reaches . Between successive members of this sequence lie narrower Farey-descendant windows, so the local structure still reflects the standard devil’s-staircase hierarchy.
2.3 Diagnostic spotlight: rotation number and Lyapunov exponent #
Figure 3 shows the staircase computed with parameter values (compared to Kaneko’s ), together with the Lyapunov exponent in a separate diagnostic panel. The rotation-number plot isolates the period-adding sequence approaching the locking, while the Lyapunov panel separates the invertible quasi-periodic regime (), the stable locked windows (), and the chaotic regime that appears after the orbit loses stability.
The Lyapunov exponent is the natural diagnostic for the circle map: it directly distinguishes locked motion () from quasi-periodic motion () and chaos (), providing a one-number summary of the dynamics at each parameter value.
How this figure was computed
# Reduced preview (20 values). Full figure: dynachaos run sec02_circle_map
import numpy as np

from dynachaos.maps.circle_map import bisect_k_inf, rotation_number

Omega = 0.25
K_values = np.linspace(0.0, 1.0, 20)
rho = [rotation_number(K, D=Omega, n_transient=500, n_iter=2000) for K in K_values]

for K, r in zip(K_values[::4], rho[::4], strict=False):
    print(f"K={K:.2f}  rho={r:.4f}")

# K_infty, the onset of the 1/5 lock, by bisection on the lift (the figure marks it; the
# full run uses 50 steps and a 100,000-step transient).
k_inf, low, high = bisect_k_inf(n_steps=12, n_transient=20_000)
print(f"K_inf = {k_inf:.6f} (bracket width {high - low:.1e})")
The self-similar locking hierarchy becomes clearer when the staircase is resolved near the onset of the plateau. Figure 4 zooms into the region containing the dominant period-adding sequence , computed with parameter values. At this scale the successive rational plateaus converging on are cleanly separated, and narrower subwindows appear between them according to the Farey-tree construction. The point of the zoom is therefore not a generic “between and ” staircase, but the specific accumulation sequence Kaneko analysed in the problem (Kaneko 1982, 1983b).
How this figure was computed
# Reduced preview (K in [0.125, 0.158], 10 values). Full figure: dynachaos run sec02_circle_map
# Below chaos onset (K ~ 0.182) lambda <= 0 here: mode-locked, regular motion.
import numpy as np

from dynachaos.maps.circle_map import lyapunov_exponent, rotation_number

Omega = 0.25
K_values = np.linspace(0.125, 0.158, 10)
for K in K_values:
    rho = rotation_number(K, D=Omega, n_transient=500, n_iter=2000)
    lam = lyapunov_exponent(K, D=Omega, n_transient=500, n_iter=2000)
    print(f"K={K:.3f}  rho={rho:.4f}  lambda={lam:+.4f}")
3 Amplitude Instability: Oscillation, Doubling, and Fractalization #
When an invariant circle loses amplitude stability independently of its phase, the torus can oscillate, double, or fractalize into a wrinkled nonchaotic set prior to the onset of positive Lyapunov exponents. Torus oscillation entered the literature in “Oscillation and Doubling of Torus” (Kaneko 1984c) as a route to chaos distinct from frequency locking and from period doubling. To see it, one needs a map that carries a smooth invariant circle whose amplitude can go unstable independently of its phase. The delayed logistic map does this with a memory term () in place of explicit time dependence: the torus lives in a two-dimensional state space and its shape can deform continuously. Sweeping the single parameter in this one model produces all three fates, oscillation, doubling, and fractalization; the monograph (Kaneko 1986a) treats them together. Here Fig. 1 of (Kaneko 1984c) is recomputed with 100 000 iterates per panel, and a 2000-value Lyapunov sweep, the correlation dimension, and SALI are added.
3.1 The delayed logistic map (canonical model) #
Kaneko (1984c) studied torus instabilities in their purest form using the two-dimensional delayed logistic map:
3.2 Torus oscillation #
As increases beyond , the torus initially grows smoothly. But at a critical value of , the torus begins to oscillate: the closed curve develops wiggles along its length. Kaneko (1984c) traced this to the damped oscillation of the unstable manifold of a periodic saddle near a frequency locking, and read it as an instability along the amplitude direction of the torus, distinct from both frequency locking and torus doubling.
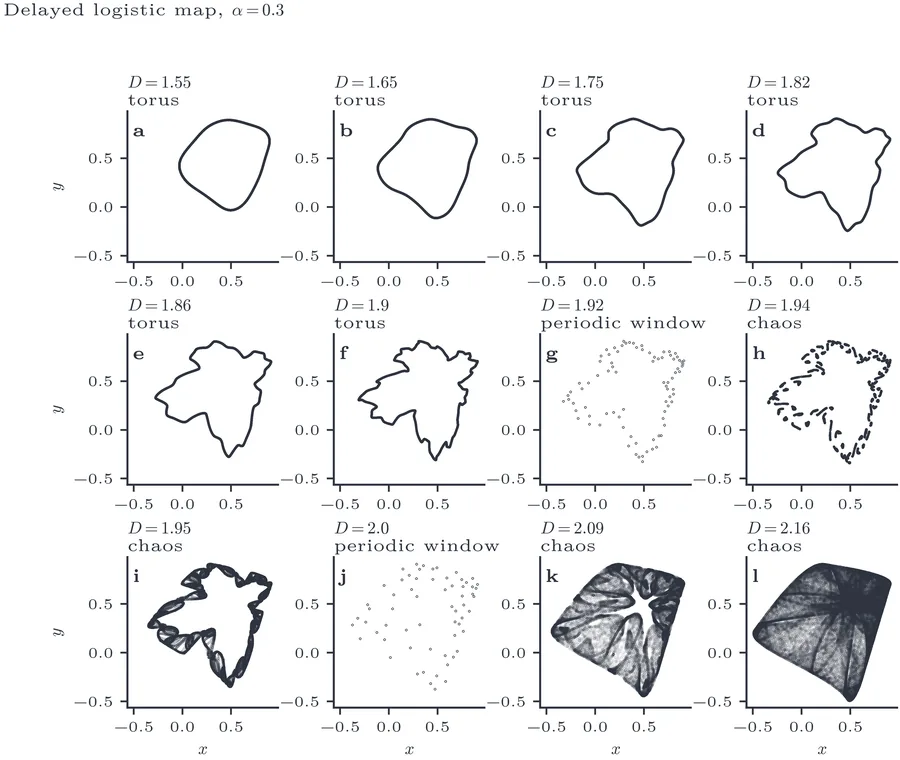
Kaneko describes the progression as increases (his Fig. 1 (Kaneko 1984c)): oscillation of the torus, then frequency lockings, then chaos emerging via a locking, then a widening belt-like chaotic attractor, until the unstable fixed point becomes a snap-back repeller. Figure 5 shows attractors along this sequence at , and Figure 7 adds two measurements: panel (a) shows the Lyapunov spectrum ( in the torus regime and in the chaotic regime); panel (b) shows the power spectrum of (dynachaos run sec05_oscillation) at and . At both values every peak is a harmonic (mod 1, folded into ) of the single rotation frequency : an invariant circle of a two-dimensional map carries one frequency. From to the higher harmonics grow by about one decade, which records the wrinkling of the circle. No independent modulation frequency appears, so in this map the oscillation of the torus is seen in its shape and in the growth of the harmonics, not as sidebands at a second frequency.
How this figure was computed
# Reduced preview (3 D values). Full figure: dynachaos run sec05_oscillation
# Attractor portraits of the delayed logistic map at alpha=0.3.
from dynachaos.maps.delayed_logistic import compute_attractor

alpha = 0.3
for D, label in ((1.55, "torus"), (1.94, "chaos"), (2.16, "developed chaos")):
    traj = compute_attractor(alpha, D, n_transient=3000, n_plot=2000)
    print(f"D={D:.2f} ({label})  y range=[{traj[:, 1].min():.3f}, {traj[:, 1].max():.3f}]")
The transition from locking to chaos in panels (f)–(h) of Figure 5 compresses a rich micro-structure into three frames. Figure 6 zooms into with eight closely-spaced values, each plotted with iterates. The sequence makes clear that the transition is not a single bifurcation but a compressed interval containing near-locking, relocking, and only then the loss of smooth invariant curves. Beyond , the attractor develops fractal filaments before settling into a fully chaotic cloud at the far end of the window.
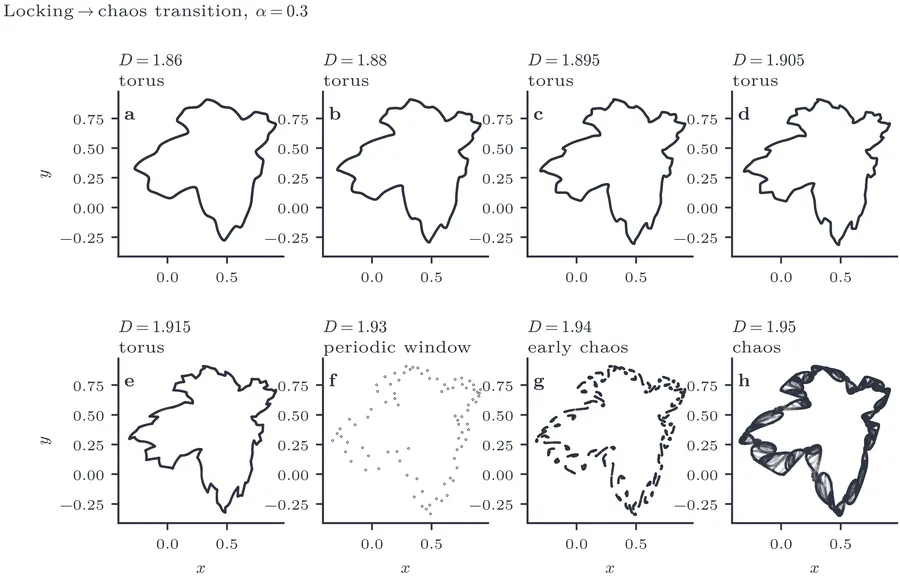
How this figure was computed
# Reduced preview (3 D values). Full figure: dynachaos run sec05_oscillation
# Dynamics across the locking-to-chaos transition, D in [1.86, 1.95] at alpha=0.3;
# lambda_1 turns positive as the frequency-locked torus gives way to chaos.
import numpy as np

from dynachaos.diagnostics.lyapunov import lyapunov_spectrum
from dynachaos.maps.delayed_logistic import delayed_logistic, delayed_logistic_jac

alpha = 0.3
for D in (1.860, 1.930, 1.950):
    fp = (np.sqrt(1.0 + 4.0 * D) - 1.0) / (2.0 * D)
    x0 = np.array([fp + 0.01, fp - 0.01])

    def f(state, D=D):
        return delayed_logistic(state, alpha, D)

    def jac(state, D=D):
        return delayed_logistic_jac(state, alpha, D)

    spectrum = lyapunov_spectrum(f, jac, x0, n_iter=4000, n_transient=2000)
    print(f"D={D:.3f}  lambda_1={spectrum[0]:+.4f}")
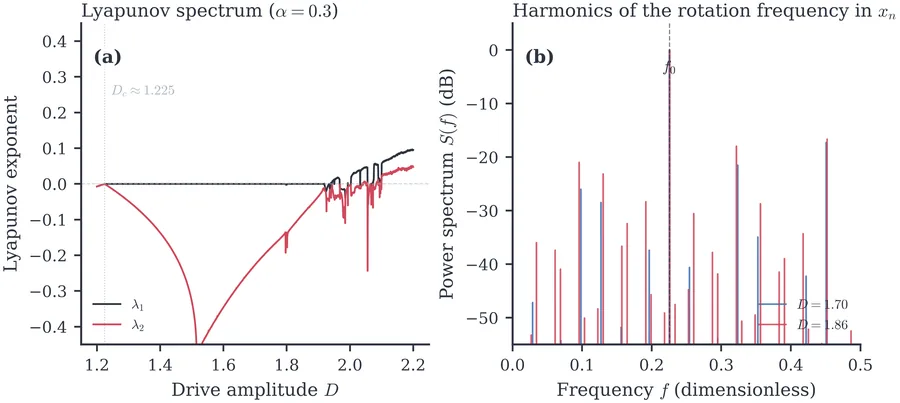
dynachaos run sec05_oscillation.How this figure was computed
# Reduced preview (3 D values, 2 power spectra). Full figure: dynachaos run sec05_oscillation
# Panel (a): Lyapunov spectrum of the delayed logistic map vs D at alpha=0.3.
# Panel (b): Power spectrum S(f) harmonics/sidebands (f0 approx 0.225) at D=1.70 and D=1.86.
import numpy as np

from dynachaos.diagnostics.lyapunov import lyapunov_spectrum
from dynachaos.maps.delayed_logistic import compute_psd, delayed_logistic, delayed_logistic_jac

alpha = 0.3
for D in (1.6, 1.95, 2.2):
    fp = (np.sqrt(1.0 + 4.0 * D) - 1.0) / (2.0 * D)
    x0 = np.array([fp + 0.01, fp - 0.01])

    def f(state, D=D):
        return delayed_logistic(state, alpha, D)

    def jac(state, D=D):
        return delayed_logistic_jac(state, alpha, D)

    spectrum = lyapunov_spectrum(f, jac, x0, n_iter=4000, n_transient=2000)
    print(f"D={D:.2f}  lambda_1={spectrum[0]:+.4f}  lambda_2={spectrum[1]:+.4f}")

# Power spectrum peak / harmonic check at D = 1.70 and D = 1.86 (rotation f0 approx 0.225)
for d_val in (1.70, 1.86):
    freqs, psd = compute_psd(alpha, d_val, n_transient=2000, n_record=2048)
    print(f"D={d_val:.2f}  dominant harmonic={freqs[np.argmax(psd)]:.3f}")
3.3 Torus doubling (Maps I and IV) #
Period doubling, the cascade whose universality Feigenbaum established (Feigenbaum 1978), is the best-known route to chaos in one-dimensional maps. Arnéodo, Coullet, and Arnéodo et al. (1983) discovered that an invariant torus can undergo an analogous cascade of period doublings in continuous-time flows. Kaneko (1983a) then demonstrated that discrete maps can exhibit the same torus-doubling cascade. Just as a fixed point can bifurcate into a period-2 orbit (two alternating points), a smooth invariant circle ( in the map; “torus” in Kaneko’s flow language) can bifurcate into a doubled torus, on which the trajectory alternates between two closed curves on successive iterates. A further doubling produces a -torus, then an -torus, and so on until the tori become so convoluted that they merge into a chaotic attractor.
Kaneko studied four maps exhibiting torus doubling (Kaneko 1983a). Maps (II) and (III) are intermediate cases that interpolate between the three-dimensional Map (I) and the four-dimensional Map (IV); we focus on the two extremes. Map (I) is a three-dimensional delayed logistic:
The parameter controls how strongly the delayed variable drives the system. As increases at fixed , the torus undergoes successive doublings: , accumulating at a critical value beyond which the motion is chaotic.
Kaneko found that the doubling cascade obeys a scaling relation analogous to Feigenbaum’s:
dynachaos run sec04_doubling) keeps throughout, so at this length it does not resolve and ; the two values are Kaneko’s. Measuring with controlled uncertainty remains open (Section 8.7).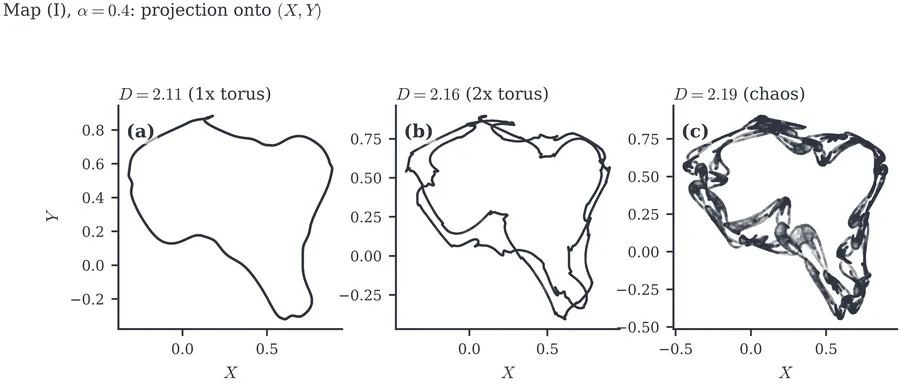
How this figure was computed
# Reduced preview (3 D values, 2000 points). Full figure: dynachaos run sec04_doubling
# Torus doubling in Map (I), Eq. (8), at alpha = 0.4: 1x torus, 2x torus, and chaos (Dc = 2.163).
# The static figure uses 10^5 iterates after a 20,000-step transient.
import numpy as np

from dynachaos.maps.torus_doubling import iterate_map, map_I

alpha = 0.4
x0 = np.array([0.5, 0.5, 0.5])
for D, label in ((2.11, "torus"), (2.16, "2x torus"), (2.19, "chaos")):
    traj = iterate_map(map_I, x0, alpha, D, n_transient=3000, n_plot=2000)
    print(f"D={D:.2f} ({label})  X range=[{traj[:, 0].min():.3f}, {traj[:, 0].max():.3f}]")
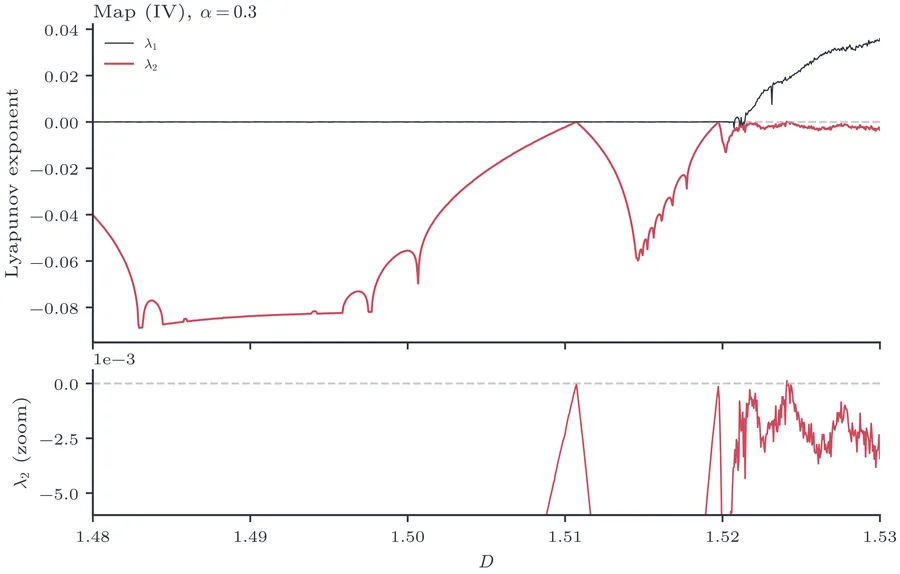
How this figure was computed
# Reduced preview (3 D values). Full figure: dynachaos run sec04_doubling
# Lyapunov spectrum of Map (IV), the 4D delayed logistic map, vs D (alpha=0.3).
import numpy as np

from dynachaos.diagnostics.lyapunov import lyapunov_spectrum
from dynachaos.maps.torus_doubling import map_IV, map_IV_jac

alpha = 0.3
x0 = np.array([0.5, 0.45, 0.52, 0.48])
for D in (1.50, 1.5206, 1.5212):

    def f(state, D=D):
        return map_IV(state, alpha, D)

    def jac(state, D=D):
        return map_IV_jac(state, alpha, D)

    spectrum = lyapunov_spectrum(f, jac, x0, n_iter=3000, n_transient=2000)
    print(f"D={D}  lambda_1={spectrum[0]:+.4f}  lambda_2={spectrum[1]:+.4f}")
3.4 Fractalization of torus #
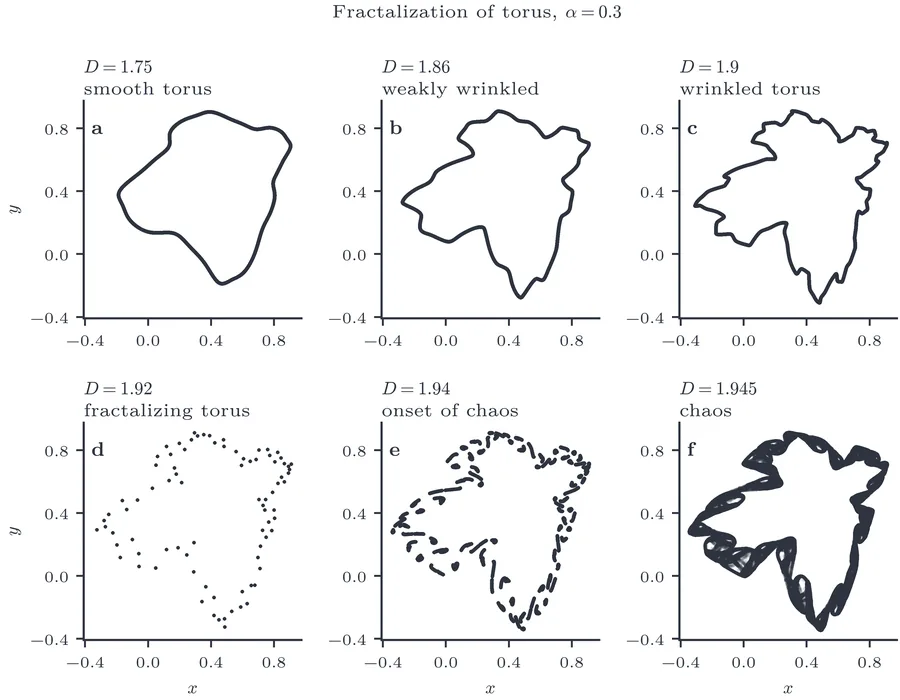
At the boundary between quasi-periodic motion and chaos, Kaneko (1984b) found no single breaking event but a continuous process: the torus fractalizes.
On a smooth torus, the attractor is a one-dimensional curve (a closed orbit in the Poincaré section). Its fractal dimension is exactly 1. As the control parameter approaches the chaos threshold, the curve develops wrinkles, fine-scale oscillations that fold it at ever smaller length scales. The fractal dimension increases continuously from 1 toward – at the onset of chaos.
At this stage, the attractor is a wrinkled invariant set whose maximal Lyapunov exponent has not yet turned positive. Classic strange nonchaotic attractors (SNAs) arise in quasiperiodically forced systems (Grebogi et al. 1984; Kuznetsov et al. 1995); here, because the delayed logistic map is an autonomous two-dimensional system and whether holds strictly on the wrinkled set is not established here, we avoid designating it an SNA and treat it simply as a fractal invariant set.
How this figure was computed
# Reduced preview (3 D values, 2000 points). Full figure: dynachaos run sec07_fractalization
# Attractor portraits of the delayed logistic map (alpha=0.3) showing progressive fractalization.
from dynachaos.maps.fractalization import iterate

alpha = 0.3
for D, label in ((1.75, "smooth torus"), (1.92, "fractal torus"), (1.945, "chaos")):
    traj = iterate(alpha, D, n_transient=2000, n_record=2000)
    x_lo, x_hi = traj[:, 0].min(), traj[:, 0].max()
    print(f"D={D} ({label})  points={traj.shape[0]}  x range=[{x_lo:.3f}, {x_hi:.3f}]")
3.5 Diagnostic spotlight: correlation dimension and SALI #
We quantify the fractalization using the Grassberger–Procaccia correlation dimension (Grassberger and Procaccia 1983). The correlation integral
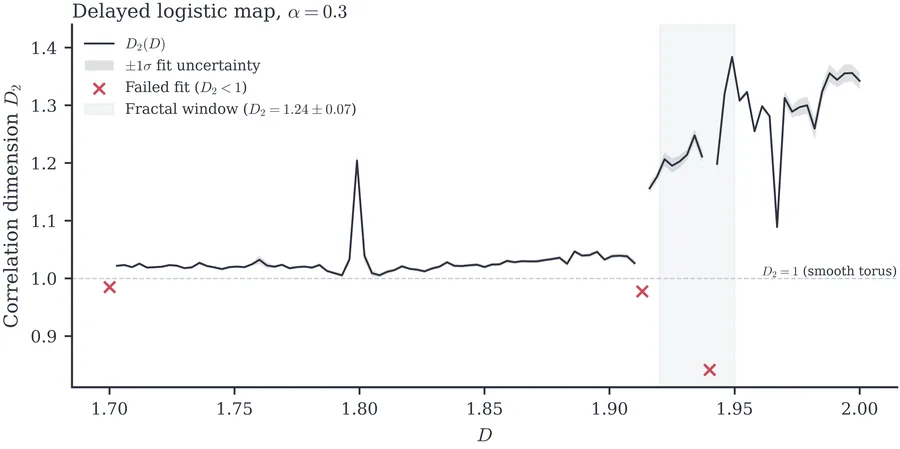
Figure 11 plots versus . Across the main fractalization window , the mean correlation dimension is (mean standard deviation across parameter values in this window, computed by dynachaos run sec07_fractalization). Individual fits that yield are identified as failed fits arising from finite-sample and scaling-window sensitivity and are excluded from the window average: 3 of the 101 fits fail (, , , with , , ), one of them inside the window, so the window mean uses 9 of 10 values. The quoted uncertainty is the scatter over the window, not a fit error; the individual regression errors are . Below the window () the curve sits at (a smooth closed curve) apart from one outlier ( at ), and above it rises to near .
The SALI (Smaller Alignment Index) (Skokos 2001) provides an alignment diagnostic based on two tangent vectors under the linearised dynamics: . The generalised index (Skokos et al. 2007) is the volume of the parallelepiped spanned by unit deviation vectors; and SALI are functions of each other. In a dissipative map, phase-space contraction pulls deviation vectors onto the neutral and expanding directions of the tangent map, even for regular orbits (Moges et al. 2025). What follows depends on how many such directions exist. Write for the Lyapunov spectrum. For random initial vectors, falls at the rate per iterate, and SALI falls at the rate of , , whenever that is negative. We test this on the four-dimensional coupled delayed logistic map of Section 5.1.
On a 2-torus of the map, . The contracting directions (, ) die out, and the two deviation vectors end in the two-dimensional tangent plane of the torus. There they need not align, so SALI and stay bounded, while and decay at the rates and . On partial locking () and on chaos () the first two vectors align, and SALI decays at the rate .
Figure 12 tests these predictions over iterates on two orbits with two zero exponents, one partially locked orbit, and one chaotic orbit. On the two tori, SALI and stay between about and . They fluctuate over about three decades and return to values near ; they do not converge to a constant. The fitted slope of over to is and per iterate (seed 0). On the same orbits decays at and per iterate (predicted and ), and at and (predicted and ). On the partially locked orbit decays at per iterate (predicted ), and on the chaotic orbit at (predicted ). SALI and decay on both of these orbits, so SALI decay alone does not separate partial locking from chaos; the decay rate does ( against per iterate). Over iterates the run cannot exclude a decay of SALI and on the tori slower than about per iterate; the rates predicted from the spectrum, and , are consistent with zero. The result is for one map (, ), two tori, one locked orbit, and one chaotic orbit.
How this figure was computed
# Reduced preview (3 D values, 3000 points). Full figure: dynachaos run sec07_fractalization
# Correlation dimension D_2(D) of the delayed logistic map (alpha = 0.3).
# Full figure uses 101 values; window [1.92, 1.95] gives D_2 = 1.24 +/- 0.07 (excluding D_2 < 1).
from dynachaos.diagnostics.correlation import correlation_dimension
from dynachaos.maps.fractalization import iterate

alpha = 0.3
for D in (1.75, 1.90, 1.945):
    traj = iterate(alpha, D, n_transient=2000, n_record=3000)
    res = correlation_dimension(traj, n_r=30, max_pairs=200_000)
    D2 = res[0]
    print(f"D={D}  D2={D2:.3f}")
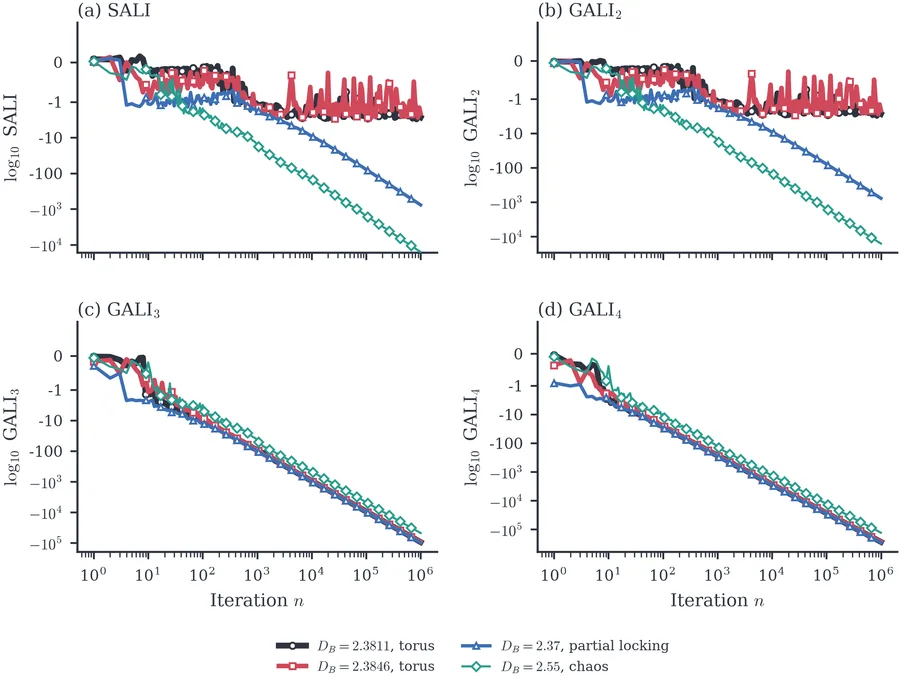
np.random.default_rng(0) (seeds 1 and 2 give the same and rates to four digits). The vertical axes show of the index on a symmetric logarithmic scale; values below are stored as logarithms. Orbits, with from a -iterate spectrum: , torus (, , , ); , torus (, , , ); , partial locking (, , , ); , chaos (, , , ). On the tori, (a) and (b) fluctuate between about and ; on partial locking and chaos they decay at ; (c) and (d) decay on all four orbits.How this figure was computed
# Reduced preview (2 orbits, 20 000 iterates). Full figure: dynachaos run sec11_diagnostics
# GALI_k decays at the rate sum_{i=2..k} (lambda_i - lambda_1) set by the Lyapunov spectrum.
import numpy as np

from dynachaos.diagnostics.alignment_three_torus import predicted_rates
from dynachaos.diagnostics.lyapunov import lyapunov_spectrum_blocks
from dynachaos.diagnostics.sali_gali import alignment_indices
from dynachaos.maps.coupled_delayed import coupled_delayed, coupled_delayed_jac

alpha, eps = 0.4, 5e-3
x0 = np.array([0.5, 0.5, 0.3, 0.3])
n_iter, n_transient = 20_000, 5000

for DB, label in ((2.37, "partial locking"), (2.55, "chaos")):
    DA = DB + 0.1

    def f(s, DA=DA, DB=DB):
        return coupled_delayed(s, alpha, DA, DB, eps)

    def jac(s, DA=DA, DB=DB):
        return coupled_delayed_jac(s, alpha, DA, DB, eps)

    spectrum, se = lyapunov_spectrum_blocks(f, jac, x0, n_iter, n_transient)
    gali = alignment_indices(f, jac, x0, k=4, n_iter=n_iter, n_transient=n_transient)
    rate, _ = predicted_rates(spectrum, se)
    fit = (gali[-1, 1:] - gali[n_iter // 2, 1:]) * np.log(10.0) / (n_iter - n_iter // 2)
    print(f"DB={DB} ({label})  lambda={np.round(spectrum, 4)}")
    print(f"  GALI_2..4 rate  fitted={np.round(fit, 4)}  predicted={np.round(rate, 4)}")
4 Symmetry Breaking: Torus Collapse via Coupling #
Coupling identical oscillators introduces exchange symmetries whose breaking produces coexisting out-of-phase attractors and complex, fractal basin boundaries. In the same year as the torus-doubling paper, Kaneko took up a second route to chaos, the transition from torus to chaos accompanied by frequency lockings with symmetry breaking (Kaneko 1983c), in two identical logistic maps coupled symmetrically. The coupled logistic map is the simplest system with two-frequency quasi-periodicity built from identical parts, and the exchange symmetry gives it a natural order parameter. The result was that symmetry breaking and basin fractality arise from the topology of coexisting attractors and not from parameter-space bifurcations alone; Takesue and Kaneko (1984) then showed that the basin boundaries are self-similar fractals. We pair a coarse survey with an attractor sequence at fixed ; this is an adaptation of Kaneko’s fixed- regime diagram. The 0-1 test is added as a model-free chaos diagnostic.
4.1 The coupled logistic map (canonical model) #
To study two-frequency quasi-periodicity (an invariant circle in this 2D return map), Kaneko introduced the coupled logistic map (Kaneko 1983c):
4.2 Phase diagram and symmetry-broken attractors #
Kaneko showed that as increases at fixed , the attractor can pass through a sequence of symmetry-preserving and symmetry-broken regimes:
Symmetric regular dynamics: fixed or periodic orbits with .
Locked windows: regular periodic windows embedded in the quasiperiodic route.
Symmetry breaking: the symmetry breaks, creating two coexisting attractors related by exchange.
Chaotic bands: irregular sets with positive finite-time expansion rate.
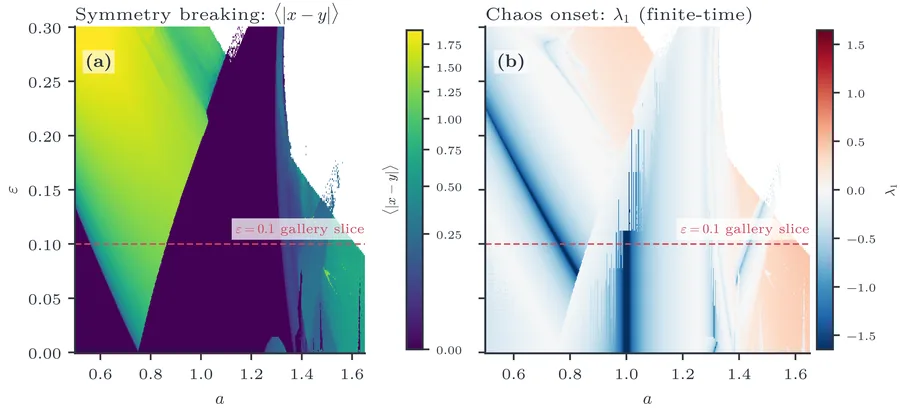
Figure 13 therefore serves as a locator map: panel (a) uses the symmetry order parameter , while panel (b) uses a finite-time estimate of the largest Lyapunov exponent . The two fields separate regions where the dynamics remains close to the invariant diagonal from regions where symmetry is broken and the motion becomes irregular. The dashed line at marks the slice used in Figure 14. That attractor gallery follows a representative branch through the route ; for the first two panels we deliberately start off the diagonal to expose the coexisting symmetry-broken tori rather than the synchronized cycles.
How this figure was computed
# Reduced preview (grid 4 x 2). Full figure: dynachaos run sec03_transition
# Symmetry breaking <|x-y|> for the coupled logistic map over an (a, eps) grid.
import numpy as np

from dynachaos.maps.coupled_logistic import coupled_logistic

for eps in (0.05, 0.1):
    for a in (1.0, 1.2, 1.35, 1.5):
        state = np.array([0.1, 0.2])
        for _ in range(5000):
            state = coupled_logistic(state, a, eps)
        asym = 0.0
        for _ in range(2000):
            state = coupled_logistic(state, a, eps)
            asym += abs(state[0] - state[1])
        asym /= 2000
        print(f"eps={eps:.2f}  a={a:.2f}  <|x-y|>={asym:.4f}")
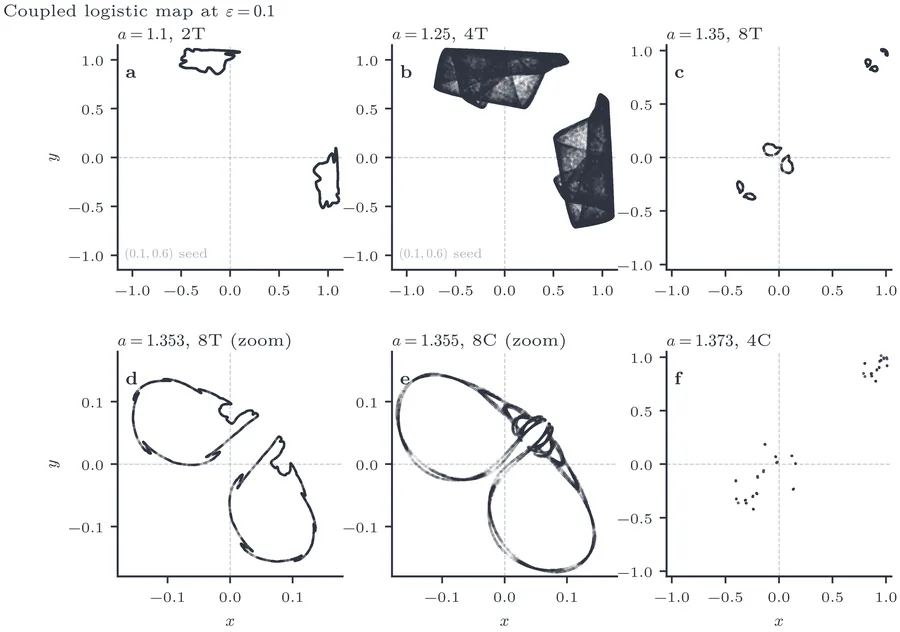
How this figure was computed
# Reduced preview (3 states, 2000 points). Full figure: dynachaos run sec03_transition
# Representative attractor portraits at eps=0.1 along the broken-symmetry route (2T -> 4T -> 4C).
# Panels (a)-(b) use initial condition (0.1, 0.6); panels (c)-(f) use (0.1, 0.2).
import numpy as np

from dynachaos.maps._iter import trajectory_after_transient
from dynachaos.maps.coupled_logistic import coupled_logistic

eps = 0.1
cases = (
    (1.10, "2T", np.array([0.1, 0.6])),
    (1.25, "4T", np.array([0.1, 0.6])),
    (1.373, "4C", np.array([0.1, 0.2])),
)

for a, label, init_state in cases:
    traj = trajectory_after_transient(
        init_state,
        lambda state, a=a: coupled_logistic(state, a, eps),
        n_transient=5000,
        n_record=2000,
    )
    print(f"a={a:.4f} ({label})  x range=[{traj[:, 0].min():.3f}, {traj[:, 0].max():.3f}]")
4.3 Self-similar basin structure #
Takesue and Kaneko (1984) showed that the basins of attraction for the two symmetry-broken attractors display an alternating stripe structure: the boundary between basins is a fractal. Figure 15 reproduces this structure at on an grid. At this parameter the map has two coexisting asymmetric 4-cycles in Kaneko’s reduced notation (period-32 cycles for the original map, where the reduced notation counts the four macroscopic clusters visited across the rapid underlying 8-cycle dynamics) together with the invariant diagonal , which flows to the synchronized cycle. The two zoom panels show stripe-like interleaving of the two basins near the diagonal at two successive magnifications. Classification evaluates the minimum Euclidean distance to the two asymmetric reference orbits over a full 32-step period rather than relying on the single-step sign of ; points on the invariant diagonal remain exactly equidistant and stay grey (dynachaos run sec03_transition).
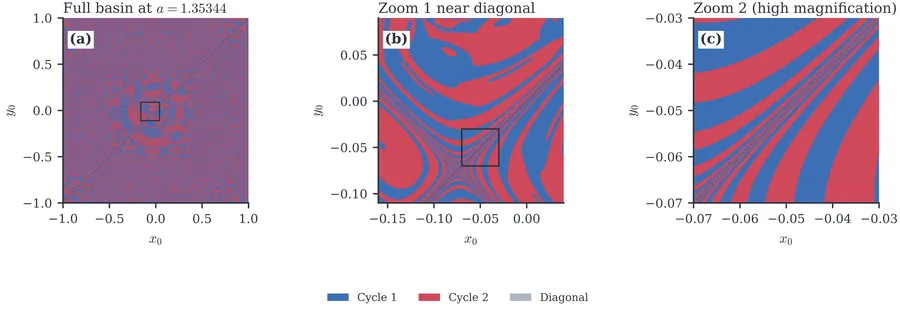
How this figure was computed
# Reduced preview (9 initial states). Full figure: dynachaos run sec03_transition
# Basins of attraction for two mirror-image asymmetric period-32 orbits at a = 1.35344, eps = 0.1.
# Orbits are classified by distance to the two reference cycles; the diagonal x = y is symmetric.
import numpy as np

from dynachaos.maps.coupled_logistic import _find_reference_orbit, coupled_logistic

a, eps = 1.35344, 0.1
ref_A = _find_reference_orbit(a, eps, 0.1, 0.6, n_transient=50_000, period=32)
ref_B = ref_A[:, ::-1]

for x0 in np.linspace(-0.05, 0.05, 9):
    state = np.array([x0, -x0])
    for _ in range(5000):
        state = coupled_logistic(state, a, eps)
    orbit = [state]
    for _ in range(31):
        state = coupled_logistic(state, a, eps)
        orbit.append(state)
    orbit = np.array(orbit)
    dA = min(np.min(np.sum((orbit - r) ** 2, axis=1)) for r in ref_A)
    dB = min(np.min(np.sum((orbit - r) ** 2, axis=1)) for r in ref_B)
    if np.isclose(dA, dB, atol=1e-12):
        basin = "diagonal"
    else:
        basin = "A" if dA < dB else "B"
    print(f"x0={x0:+.3f}  basin={basin}  dist_A={dA:.2e}  dist_B={dB:.2e}")
4.4 Diagnostic spotlight: the 0-1 test for chaos #
The 0-1 test (Gottwald and Melbourne 2004, 2009) provides a binary answer from a scalar time series alone: the test statistic approaches 0 for regular dynamics and 1 for chaotic dynamics. The method projects the time series onto a 2D extension via
Figure 16 shows versus for the logistic map . The periodic windows (where ) are sharply delineated from the chaotic bands (where ), agreeing with the sign of the Lyapunov exponent but without requiring any knowledge of the map’s equations or derivatives. Frequencies are sampled randomly from with to avoid false chaos from resonances with low-period orbits (such as resonant with period-3 cycles), taking the median correlation value as .
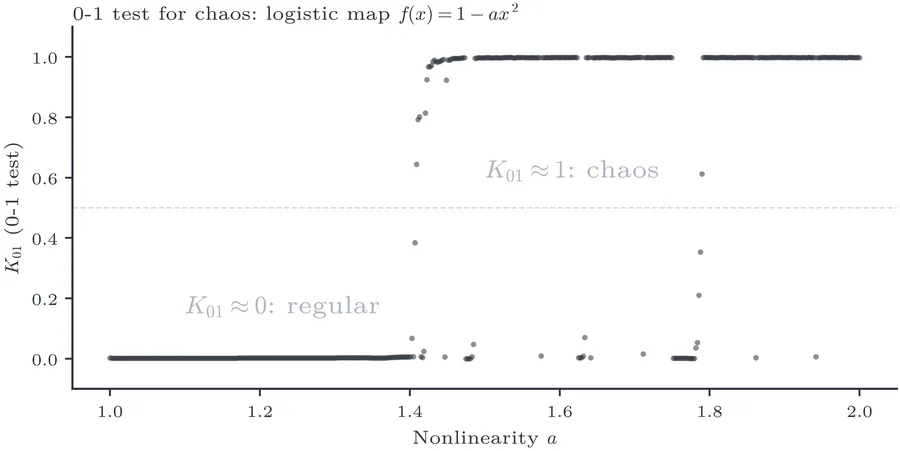
How this figure was computed
# Reduced preview (4 a values, 5000 points, n_c=50). Full figure: dynachaos run sec11_diagnostics
# 0-1 test statistic K_01 across the logistic map's route to chaos.
import numpy as np

from dynachaos.diagnostics.zero_one_test import zero_one_statistic
from dynachaos.maps.primitives import logistic

for a in (1.2, 1.6, 1.9, 2.0):
    x = 0.1
    for _ in range(2000):
        x = logistic(x, a)
    series = np.empty(5000)
    for i in range(5000):
        x = logistic(x, a)
        series[i] = x
    K = zero_one_statistic(series, n_c=50)
    print(f"a={a:.2f}  K_01={K:.3f}")
5 High-Dimensional Extension: Three-Torus and Forced Phase Maps #
Higher-dimensional tori collapse into chaos through intermediate resonant lockings rather than direct disintegration, giving rise to multi-frequency double staircases. “Fates of Three-Torus” (Kaneko 1984a) addresses the Ruelle–Takens conjecture that three-frequency quasi-periodicity is structurally unstable. Ruelle and Takens (1971) had argued that is generically destroyed by perturbations, and Grebogi et al. (1983) had found numerically that three-frequency orbits are rare. Kaneko’s question was what replaces the torus. A four-dimensional coupled delayed logistic map removes every continuous-time complication and leaves the competition among three frequencies in the simplest discrete setting. In that map he found a double devil’s staircase of lockings, a new fractalization phenomenon, and a transition to chaos that passes through intermediate lockings ( cycle chaos) and never, in his scans, leaves directly. This is a longer list than the stable-or-unstable verdict of Ruelle–Takens. Grebogi et al. (Grebogi et al. 1985) independently studied attractors on -tori. We recompute the double staircase and representative projections at modern resolution.
The mechanisms in Sections 2–4 act in one or two dimensions. The next step adds a third incommensurate frequency.
5.1 The coupled delayed logistic map #
A three-torus is a quasi-periodic attractor with three independent, incommensurate frequencies . It is the dynamical object that appears in Landau’s route to turbulence (Landau 1944) after three Hopf bifurcations. Ruelle and Takens (1971) argued that should be structurally unstable: generic perturbations destroy it and replace it with a strange attractor. Newhouse et al. (1978) proved this for certain perturbations. Kaneko’s question was which objects replace .
To study , Kaneko constructed a four-dimensional map (Kaneko 1984a):
5.2 Lyapunov counting for -tori in maps versus flows #
The four-dimensional Lyapunov spectrum distinguishes the dynamical regimes:
, : three-frequency quasi-periodicity (a invariant set in the map, corresponding to three-torus motion in the underlying flow).
One zero exponent: a single resonant frequency locking condition reduces the neutral directions by one; the remaining two-frequency motion lives on an invariant circle in the map.
All exponents negative: fully locked periodic orbit.
: chaos (the torus has collapsed).
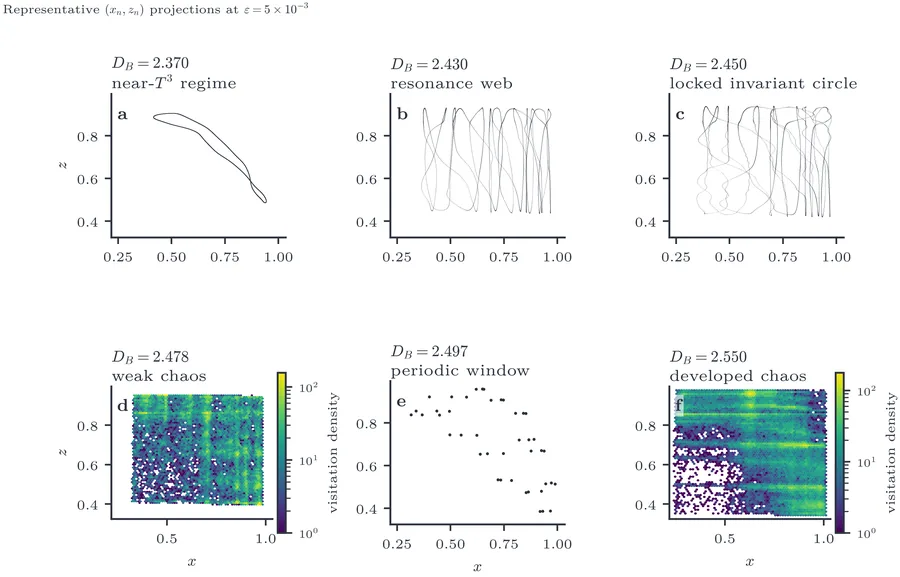
Figure 17 shows the Lyapunov spectrum versus for three values of the coupling . The corresponding projections (Figure 18) provide a geometric gallery at : a near-three-frequency curve, resonance webs and locked circles, weak chaos, a narrow periodic window, and developed chaos.
5.3 Double devil’s staircase #
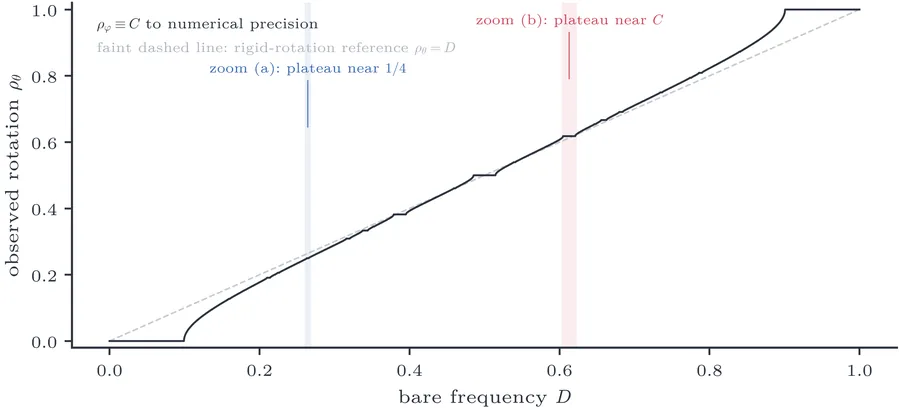
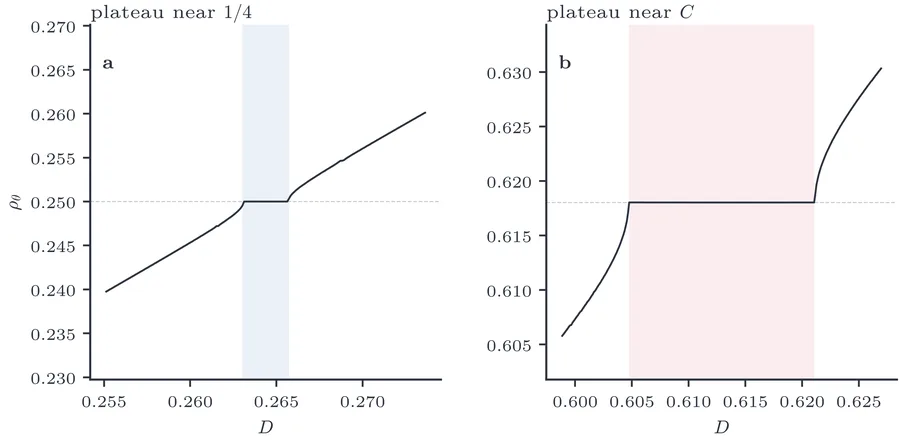
The double devil’s staircase is Kaneko’s name for the locking structure of the partially locked torus: when the three-frequency motion partially locks, the rotation number takes values of the form (where ), with the irrational modulation frequency. The staircase is “double” because its plateaus are built from two incommensurate frequencies ( and ), in contrast to the single-generator structure of the ordinary devil’s staircase (Kaneko 1984a). Our sweep computes the rotation numbers directly; it agrees with the two-generator picture but does not decompose every plateau into its rational parts.
5.4 Modulated circle map #
To demonstrate the double staircase cleanly, Kaneko introduced the modulated circle map (Kaneko 1984a):
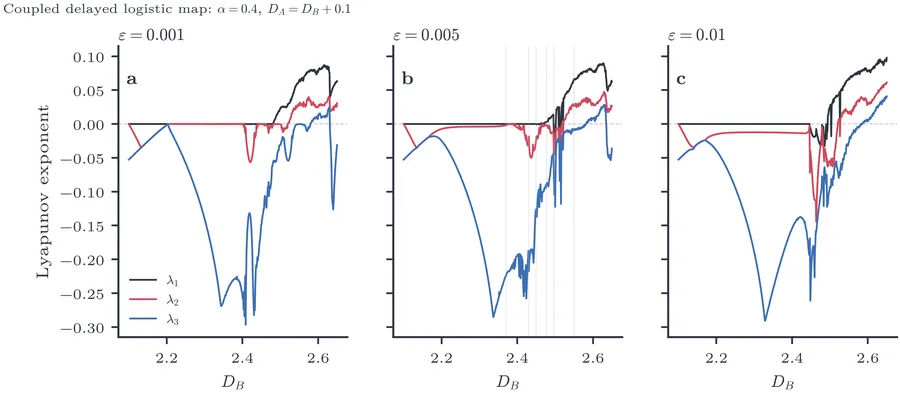
How this figure was computed
# Reduced preview (3 D_B values). Full figure: dynachaos run sec06_three_torus
# Lyapunov spectrum of the 4D coupled delayed logistic map vs D_B (alpha=0.4, eps=5e-3).
import numpy as np

from dynachaos.diagnostics.lyapunov import lyapunov_spectrum
from dynachaos.maps.coupled_delayed import coupled_delayed, coupled_delayed_jac

alpha, eps = 0.4, 5e-3
x0 = np.array([0.5, 0.5, 0.3, 0.3])
for DB in (2.37, 2.478, 2.55):
    DA = DB + 0.1

    def f(state, DA=DA, DB=DB):
        return coupled_delayed(state, alpha, DA, DB, eps)

    def jac(state, DA=DA, DB=DB):
        return coupled_delayed_jac(state, alpha, DA, DB, eps)

    spectrum = lyapunov_spectrum(f, jac, x0, n_iter=2000, n_transient=1000)
    print(f"D_B={DB:.3f}  lambda_1={spectrum[0]:+.4f}  lambda_2={spectrum[1]:+.4f}")
How this figure was computed
# Reduced preview (2 D_B values, 1000 points). Full figure: dynachaos run sec06_three_torus
# (x_n, z_n) projections of the 4D coupled delayed logistic map (alpha=0.4, eps=5e-3).
import numpy as np

from dynachaos.maps._iter import trajectory_after_transient
from dynachaos.maps.coupled_delayed import coupled_delayed

alpha, eps = 0.4, 5e-3
for DB, label in ((2.37, "near-T^3"), (2.55, "developed chaos")):
    DA = DB + 0.1
    traj = trajectory_after_transient(
        np.array([0.5, 0.5, 0.3, 0.3]),
        lambda state, DA=DA, DB=DB: coupled_delayed(state, alpha, DA, DB, eps),
        n_transient=2000,
        n_record=1000,
        project_fn=lambda state: state[[0, 2]],
    )
    print(f"D_B={DB} ({label})  x range=[{traj[:, 0].min():.3f}, {traj[:, 0].max():.3f}]")
How this figure was computed
# Reduced preview (6 points). Full figure: dynachaos run sec06_three_torus
# Double devil's staircase: rotation number rho_theta(D) of the modulated circle map.
import numpy as np

from dynachaos.maps.modulated_circle import C_GOLDEN, rotation_numbers

A, eps = 0.10, 0.05
for D in np.linspace(0.0, 1.0, 6):
    rho_theta, rho_phi = rotation_numbers(A, C_GOLDEN, D, eps, n_transient=500, n_iter=2000)
    print(f"D={D:.2f}  rho_theta={rho_theta:.4f}  rho_phi={rho_phi:.4f}")
The partial locking structure becomes clearer when zoomed into narrower windows of . Figure 20 shows two such windows. Panel (a) resolves a narrow plateau near ; panel (b) shows a broader plateau near . Together they illustrate that the staircase contains both ordinary rational lockings and plateaus tied to the irrational modulation frequency.
How this figure was computed
# Reduced preview (8 values in 1/4 plateau). Full figure: dynachaos run sec06_three_torus
# Zoom into the 1/4 mode-locked plateau of the double devil's staircase.
import numpy as np

from dynachaos.maps.modulated_circle import C_GOLDEN, rotation_numbers

A, eps = 0.10, 0.05
for D in np.linspace(0.2631, 0.2654, 8):
    rho_theta, _ = rotation_numbers(A, C_GOLDEN, D, eps, n_transient=2000, n_iter=8000)
    print(f"D={D:.4f}  rho_theta={rho_theta:.5f}")
5.5 Diagnostic spotlight: permutation entropy and complexity-entropy plane #
Permutation entropy (Bandt and Pompe 2002) quantifies the complexity of a time series by examining the relative ordering of consecutive values. Each window of values defines an ordinal pattern (permutation of ). The normalised Shannon entropy of the pattern distribution gives
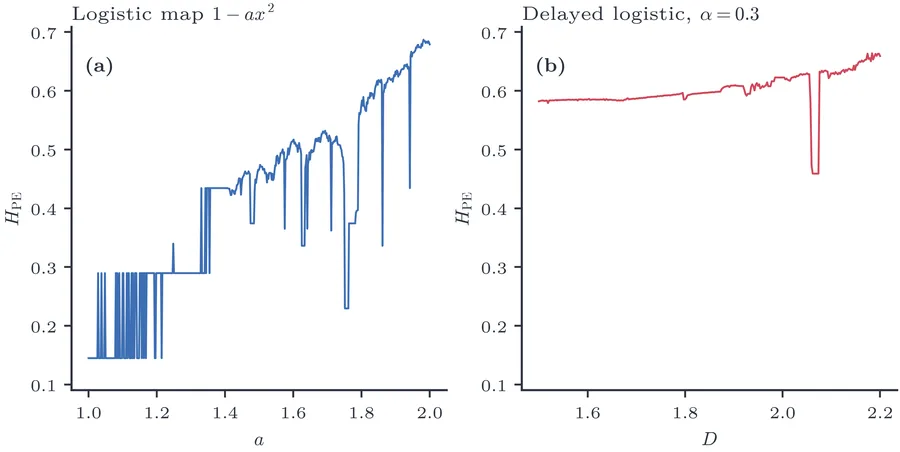
For an embedding dimension , a periodic orbit of period supports at most distinct ordinal permutations among the possible patterns. When each pattern appears with equal frequency , the normalised permutation entropy takes the exact value , producing discrete plateaus at for period 2 (), for period 4 (), and for period 8 (). These plateaus explain the discrete steps visible in Figure 21, rather than an immediate drop to zero. More irregular dynamics populates many patterns, pushing upward. Combined with the Jensen–Shannon statistical complexity (Rosso et al. 2007), the pair locates the dynamics in a complexity-entropy plane (Figure 22). Noise occupies the high-, low- corner; chaos occupies an intermediate region; and periodic motion clusters near the lower boundary.
As a compact benchmark, we evaluate these diagnostics on scalar observables from the logistic and delayed logistic maps (Figure 21). This keeps the interpretation simple while showing how entropy-based diagnostics track the shift from regular to more irregular dynamics without requiring Jacobian estimates or explicit phase-space reconstructions.
How this figure was computed
# Reduced preview (4 a values). Full figure: dynachaos run sec11_diagnostics
# Permutation entropy H_PE(a) for the logistic map (d=5).
import numpy as np

from dynachaos.diagnostics.permutation import permutation_entropy
from dynachaos.maps.primitives import logistic

for a in (1.2, 1.6, 1.9, 2.0):
    x = 0.1
    for _ in range(2000):
        x = logistic(x, a)
    series = np.empty(2000)
    for i in range(2000):
        x = logistic(x, a)
        series[i] = x
    H = permutation_entropy(series, d=5)
    print(f"a={a:.2f}  H_PE={H:.3f}")

# Full figure: dynachaos run sec11_diagnostics
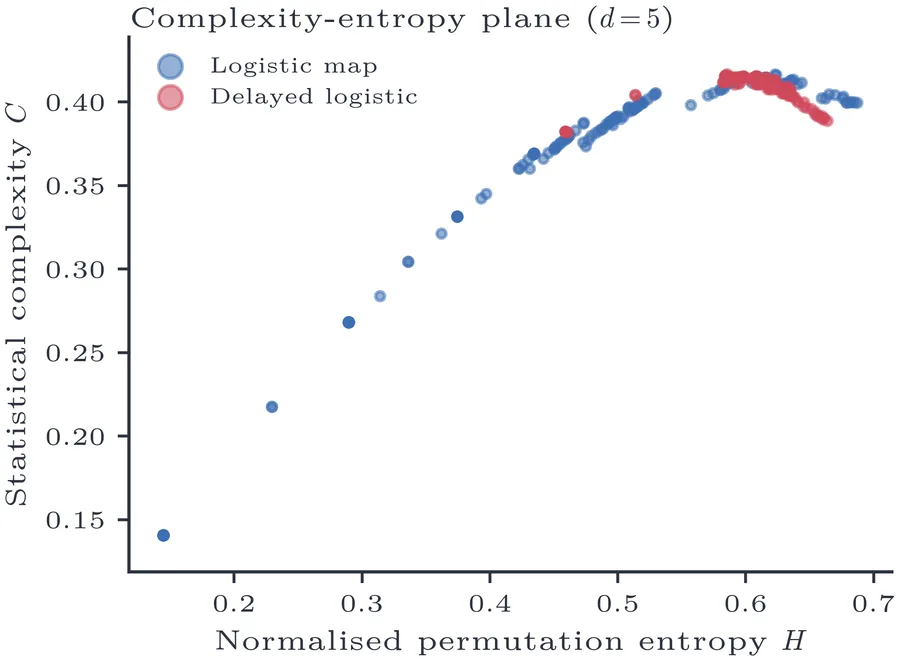
How this figure was computed
# Reduced preview (4 a values). Full figure: dynachaos run sec11_diagnostics
# Complexity-entropy plane (H, C) locating logistic-map regimes (d=5).
import numpy as np

from dynachaos.diagnostics.permutation import complexity_entropy
from dynachaos.maps.primitives import logistic

for a in (1.2, 1.6, 1.9, 2.0):
    x = 0.1
    for _ in range(2000):
        x = logistic(x, a)
    series = np.empty(2000)
    for i in range(2000):
        x = logistic(x, a)
        series[i] = x
    H, C = complexity_entropy(series, d=5)
    print(f"a={a:.2f}  H={H:.3f}  C={C:.3f}")

# Full figure: dynachaos run sec11_diagnostics
6 Spatial Extension: Coupled Map Lattices #
Coupling chaotic maps on a spatial lattice produces spatiotemporal intermittency and pattern competition, where local chaos propagates across space with a well-defined speed. The coupled map lattice (Kaneko 1985) followed Kaneko’s study of kink–antikink dynamics (Kaneko 1984d). It is a minimal spatially extended dynamical system: discrete time, discrete space, continuous state, and no partial differential equation. The question it was built for is what changes when many chaotic maps are coupled in space. The answer that mattered most was spatiotemporal intermittency (STI), a coexistence of laminar and bursting regions. Crutchfield and Kaneko (1987) surveyed the broad phenomenology and pattern classification of CMLs, while Bunimovich and Sinai (1988) provided a rigorous statistical-mechanics foundation proving the existence of spacetime chaos for hyperbolic map lattices. In the coupled-map-lattice and globally-coupled-map sections, “turbulent” and “turbulence” mean spatiotemporally disordered, high-dimensional chaotic phases in Kaneko’s sense, not solutions of the Navier–Stokes equations. Waller and Kapral (1984) and Kapral (1985) introduced similar lattices of coupled oscillators independently, and Chaté and Chaté and Manneville (1988a) later studied the STI transition in detail. We recompute Kaneko’s spacetime diagrams on 200 sites for 500 steps, add a spatial activity map on a 200 by 160 parameter grid, and use recurrence quantification analysis as a single-site benchmark.
6.1 CML definition and three models #
A coupled map lattice (CML) is a discrete-time, discrete-space dynamical system (Kaneko 1985):
Kaneko studied three CML models with different local dynamics:
A piecewise map, for and for , with , and .
Coupled circle maps with and .
Coupled logistic maps with and .
6.2 Spatiotemporal intermittency and directed percolation #
All three models exhibit spatiotemporal intermittency (STI): the spacetime diagram (Figure 23) shows alternating laminar (ordered) and burst (disordered) regions. As the coupling is tuned, the fraction of bursts changes continuously, analogous to a phase transition.
Kaneko reduced the laminar/burst dynamics to a binary (cellular automaton) description (Kaneko 1985) and characterised the transition through burst-propagation speed with –, and the growth of positive Lyapunov exponents. Pomeau (1986) suggested a connection to the universality class of directed percolation (DP), the standard absorbing-state transition of non-equilibrium statistical mechanics (Hinrichsen 2000). Chaté and Chaté and Manneville (1988a, 1988b) investigated this connection and found DP-like scaling features in deterministic spatiotemporal intermittency, while noting that the critical exponents may depend on whether the laminar state is strictly absorbing (Chaté and Manneville 1989b, 1989a); Kaneko himself noted that “the universality class on critical exponents seems to be different” (Kaneko 1989b).
To complement the qualitative spacetime view with quantitative measures, we extract an STI “spine” from the Kaneko Model-A CML (dynachaos run sec12_intermittency; Figure 24): the turbulent fraction as a function of the coupling , together with the laminar-domain size distribution, where an active site is defined by the local burst departure threshold . The turbulent fraction is zero up to , rises between and , and reaches a burst-dominated plateau for . At the whole lattice is laminar, so there is no laminar-length distribution. At the distribution is broad (lengths up to 50 sites); among a power law, an exponential and a truncated power law, the power law has the lowest BIC (), but the Kolmogorov–Smirnov distances, evaluated at each integer length, reject all three: 0.074 for the power law and the truncated power law and 0.14 for the exponential, against a 5 % critical value of for lengths (the critical value assumes independent lengths). At laminar runs are at most six sites long and the exponential fits (rate , distance 0.002 against a critical value of 0.017). The data therefore locate the onset but do not determine the form of the laminar-length distribution there. Testing whether the system falls in the directed percolation (DP) class requires finite-size scaling at the critical coupling , which is not performed here. Critical exponents of directed percolation have been measured in coupled circle-map lattices (Janaki et al. 2003; Jabeen and Gupte 2005, 2006) and in a ferrofluid experiment (Rupp et al. 2003). What remains open is a rigorous mathematical proof and whether the Model-A lattice studied here belongs to the DP universality class.
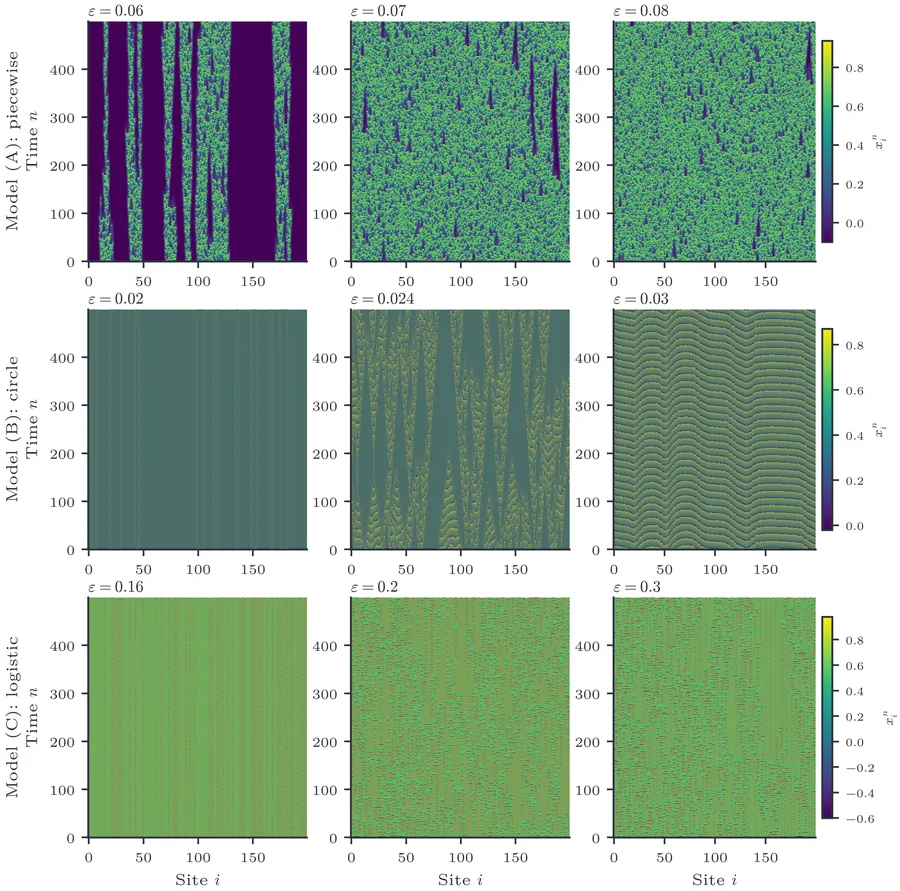
How this figure was computed
# Reduced preview (N = 60, 50 steps). Full figure: dynachaos run sec08_sti
# Spacetime diagrams of a coupled map lattice (Kaneko 1985 Model C, logistic local map).
from dynachaos.cml.spatiotemporal import model_C_f, simulate_cml

N = 60
for eps in (0.16, 0.20, 0.30):
    spacetime = simulate_cml(model_C_f, model_C_f, eps, N=N, n_transient=200, n_record=50)
    print(f"eps={eps:.2f}  final-row var={spacetime[-1].var():.4f}")

# Full figure: dynachaos run sec08_sti
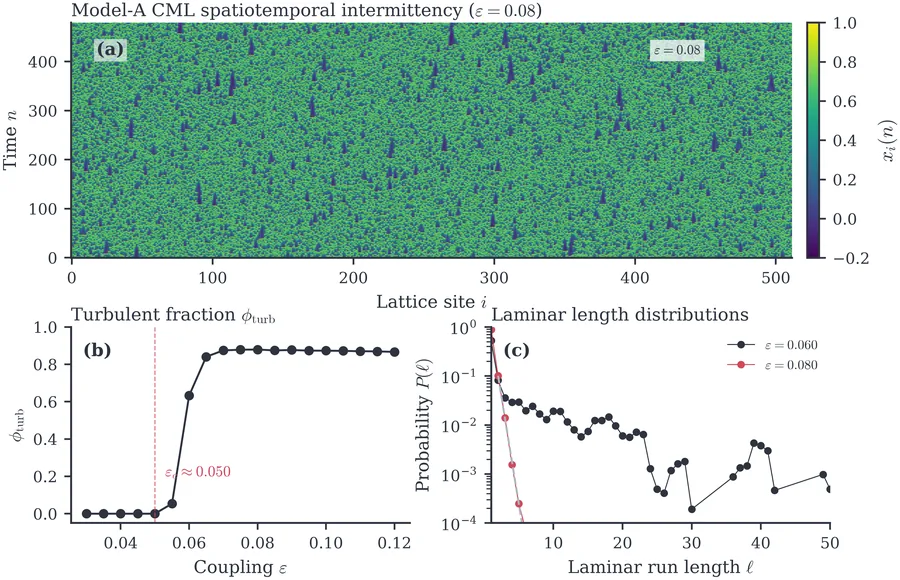
dynachaos run sec12_intermittency.How this figure was computed
# Reduced preview (N = 256, 100 steps). Full figure: dynachaos run sec12_intermittency
# Quantitative STI spine for Kaneko Model-A CML: turbulent fraction vs coupling eps, the critical
# coupling eps_c, and maximum-likelihood fits of the laminar-length tail (power law, exponential,
# truncated power law).
# Full figure: N = 512, phi_turb at 19 couplings in [0.03, 0.12], fits at eps_c, 0.060 and 0.080.
import numpy as np

from dynachaos.cml.spatiotemporal import model_A_f, simulate_cml
from dynachaos.cml.sti_spine_figure import (
    _burst_mask,
    _periodic_run_lengths,
    fit_tail_models,
    locate_critical_coupling,
)

N = 256
sweep_eps = np.linspace(0.03, 0.12, 10)
fractions = []
for idx, eps in enumerate(sweep_eps):
    rng = np.random.default_rng(42 + idx)
    spacetime = simulate_cml(
        model_A_f,
        model_A_f,
        float(eps),
        N=N,
        n_transient=500,
        n_record=100,
        x0=rng.uniform(0, 1, N),
    )
    fractions.append(_burst_mask(spacetime).mean())
    print(f"eps={eps:.3f}  turbulent_fraction={fractions[-1]:.3f}")
print(f"eps_c = {locate_critical_coupling(sweep_eps, fractions):.3f}")

lengths = _periodic_run_lengths(~_burst_mask(spacetime))
fit = fit_tail_models(lengths, x_min=2)
print(f"laminar tail at eps=0.12: n={fit['n_tail']}  preferred={fit['preferred']}")
6.3 Pattern dynamics (five phases) #
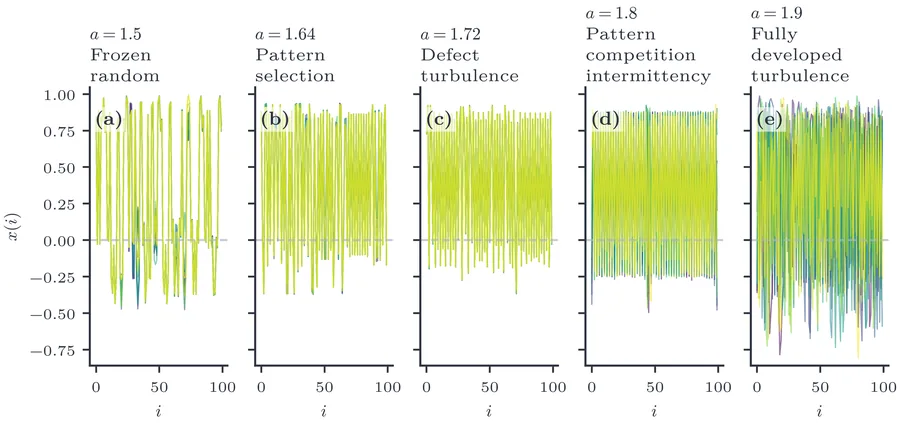
Kaneko (1989b) systematically classified the dynamics of the CML (13) with the logistic map and . The canonical taxonomy in the plane contains five phases:
Frozen random (, moderate ): the lattice settles into a static, spatially disordered pattern.
Pattern selection (–): the lattice spontaneously selects a spatially periodic pattern, breaking translational symmetry.
Defect turbulence (–): the selected pattern is disrupted by defects (domain walls) that nucleate, propagate, and annihilate chaotically.
Pattern competition intermittency (–): large coherent domains compete for territory, punctuated by intermittent bursts of turbulence.
Fully developed turbulence (): all spatial coherence is lost.
Figure 25 shows a spatial activity map computed on a grid (versus Kaneko’s ): the mean difference between neighbouring sites, , averaged over the lattice and over time. It separates spatially smooth from spatially rough states, so the figure should be read as a locator map consistent with the five-phase taxonomy, not as an automatic phase classifier. Figure 26 then shows space-amplitude plots at for five values of marked on that map.
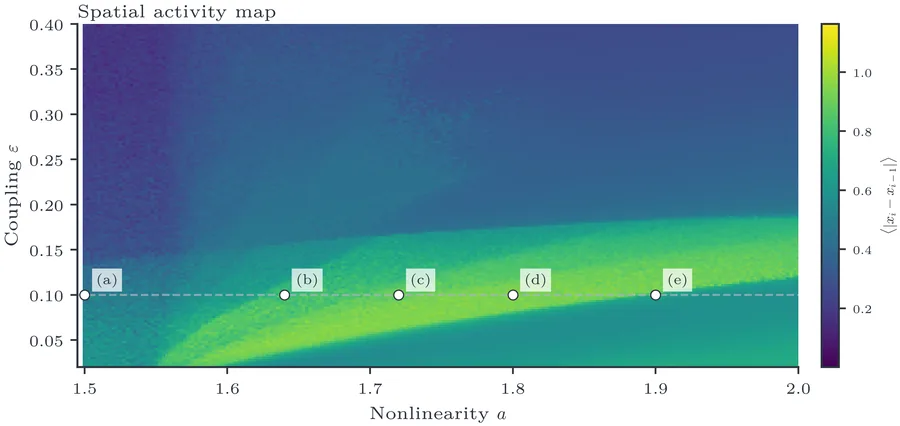
How this figure was computed
# Reduced preview (3 (a, eps) states, N = 100, 500-step transient, 200 samples).
# Full figure: dynachaos run sec09_pattern (200 x 160 grid, 2000 samples after 5000 transient).
# Spatial activity <|x_i - x_{i-1}|> of the logistic coupled map lattice
# (Kaneko 1989) separates spatially smooth from spatially rough states.
import numpy as np

from dynachaos.cml.primitives import cml_step_logistic as cml_step

N = 100
rng = np.random.default_rng(42)
for a, eps in ((1.50, 0.10), (1.72, 0.10), (1.90, 0.10)):
    x = rng.uniform(-1, 1, N)
    for _ in range(500):
        x = cml_step(x, a, eps)
    activity = 0.0
    for _ in range(200):
        x = cml_step(x, a, eps)
        activity += np.mean(np.abs(x - np.roll(x, 1)))
    print(f"a={a:.2f} eps={eps:.2f}  spatial activity={activity / 200:.4f}")
How this figure was computed
# Reduced preview (2 a states, N = 100). Full figure: dynachaos run sec09_pattern
# Space-amplitude snapshots x(i) vs site i of a logistic coupled map lattice (N = 100).
import numpy as np

from dynachaos.cml.primitives import cml_step_logistic as cml_step

N = 100
rng = np.random.default_rng(42)
for a, eps, label in ((1.50, 0.10, "frozen random"), (1.90, 0.10, "fully developed turbulence")):
    x = rng.uniform(-1, 1, N)
    for _ in range(500):
        x = cml_step(x, a, eps)
    snapshot = x.copy()
    print(f"a={a:.2f} ({label})  amplitude mean={snapshot.mean():.4f} std={snapshot.std():.4f}")
6.4 Co-moving Lyapunov exponent and information flow #
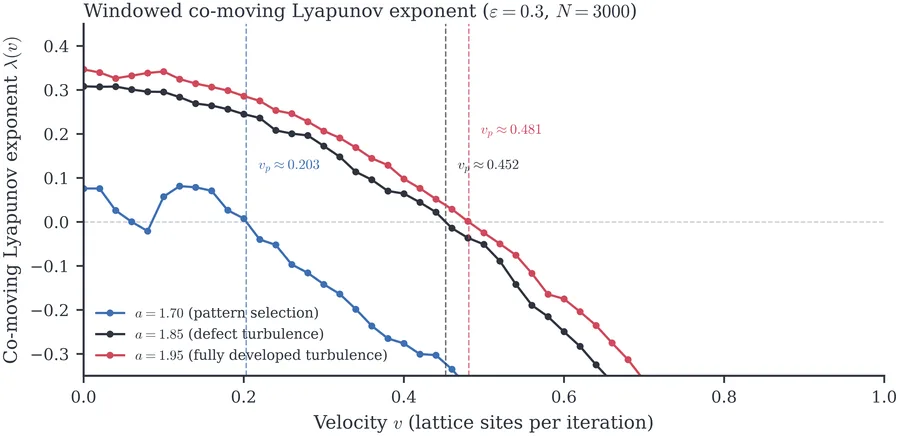
Kaneko (1986b) introduced the co-moving Lyapunov exponent to quantify how perturbations propagate through a CML. Consider a localised perturbation evolving under the linearised CML dynamics:
dynachaos run sec08_sti).When , a perturbation travelling at velocity grows exponentially; the propagation speed is the velocity at which crosses zero. Kaneko (1992c) showed that is finite for spatiotemporally chaotic CMLs, so disturbances spread at a well-defined speed, a discrete-map precursor of the convective/absolute instability distinction in spatiotemporal chaos.
Figure 27 shows for three CML regimes: pattern selection (), pattern competition intermittency (), and fully developed turbulence (). The zero crossings give propagation speeds – for and – for ; the range is the change when the averaging time is doubled from to . For the curve is positive near () and crosses zero between and , but the crossing moves with and is not converged.
dynachaos run sec08_sti.How this figure was computed
# Reduced preview (windowed estimator, N = 400, T = 150, 4 velocities).
# Full figure: dynachaos run sec08_sti
# Windowed co-moving Lyapunov exponent lambda(v) for a logistic coupled map lattice (eps = 0.3):
# growth of the perturbation norm over a window of 2 w + 1 sites that moves with velocity v.
# Static figure: N = 3000, T = 1000, w = 15, 51 velocities on [0, 1]; zero crossings give v_p.
import numpy as np

from dynachaos.diagnostics.comoving_lyapunov import (
    comoving_lyapunov_windowed_logistic,
    comoving_zero_crossings,
)

v_values = np.linspace(0.0, 1.0, 4)
for a in (1.70, 1.85, 1.95):
    lam_v = comoving_lyapunov_windowed_logistic(
        a=a, eps=0.3, N=400, T=150, v_values=v_values, n_transient=500, w=5, i0=50
    )
    crossings = comoving_zero_crossings(v_values, lam_v)
    print(f"a={a:.2f}  lambda(v)={np.round(lam_v, 3)}  zero crossings={np.round(crossings, 2)}")
6.5 Thermodynamics of spatiotemporal chaos #
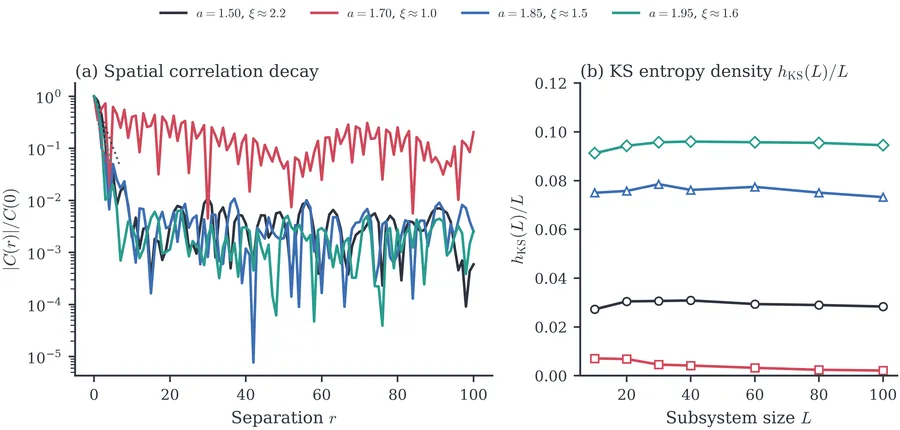
For a CML with sites, the full Lyapunov spectrum grows with system size. Kaneko (1989d) introduced the concept of intensive thermodynamic quantities for spatiotemporal chaos: the KS entropy density , the Lyapunov dimension density , and the density of positive Lyapunov exponents. When the spatial correlation length is much smaller than the system size , these densities converge to well-defined intensive values, and the CML behaves like a thermodynamic system with local degrees of freedom.
This convergence breaks down near phase transitions (where ) and in the pattern selection phase (where long-range spatial order imposes correlations across the lattice). Figure 28 combines the spatial correlation function with the Kolmogorov–Sinai entropy density (dynachaos run sec08_sti). Rather than using an intensive ratio like (which decreases as by construction), extensivity is tested by computing the sum of all positive Lyapunov exponents of the -site subsystem Jacobian divided by . For and , stays within about 5 % of a constant over – ( and ), consistent with extensive chaos. For it is also nearly constant (); for it falls from to over the same range, so extensivity is not seen there.
dynachaos run sec08_sti.How this figure was computed
# Reduced preview (N = 60, 4 a values). Full figure: dynachaos run sec08_sti
# Spatial autocorrelation C(r)/C(0) of a logistic coupled map lattice (eps = 0.3).
# 4 a values (1.50, 1.70, 1.85, 1.95); static figure adds panel (b), the KS entropy density
# h_KS(L)/L, the sum of the positive Lyapunov exponents of an L-site subsystem divided by L.
import numpy as np

from dynachaos.cml.correlation_figure import compute_ks_entropy_density
from dynachaos.cml.primitives import cml_step_logistic as cml_step

N = 60
eps = 0.3
rng = np.random.default_rng(42)
for a in (1.50, 1.70, 1.85, 1.95):
    x = rng.uniform(-0.5, 0.5, N)
    for _ in range(500):
        x = cml_step(x, a, eps)
    snapshots = np.empty((200, N))
    for s in range(200):
        x = cml_step(x, a, eps)
        snapshots[s] = x
    fluct = snapshots - snapshots.mean()
    fft_f = np.fft.rfft(fluct, axis=1)
    power = (fft_f * np.conj(fft_f)).real
    full_corr = np.fft.irfft(power, n=N, axis=1).mean(axis=0) / N
    c_norm = full_corr / full_corr[0]
    print(f"a={a:.2f}  C(r=0..3)/C(0)={np.round(c_norm[:4], 3)}")

# h_KS(L)/L on a small lattice (N = 40, L = 10 and 20, 400 steps): the chaotic states carry
# entropy per site, the pattern-selection state (a = 1.70) very little.
a_values, L_values, h_density = compute_ks_entropy_density(
    N=40, a_values=(1.70, 1.95), L_values=(10, 20), n_transient=300, n_iter=400
)
for a, row in zip(a_values, h_density, strict=True):
    print(f"a={a:.2f}  h_KS(L)/L for L={L_values.tolist()}: {np.round(row, 4)}")

# Full figure: dynachaos run sec08_sti
6.6 Diagnostic spotlight: RQA and spacetime recurrence #
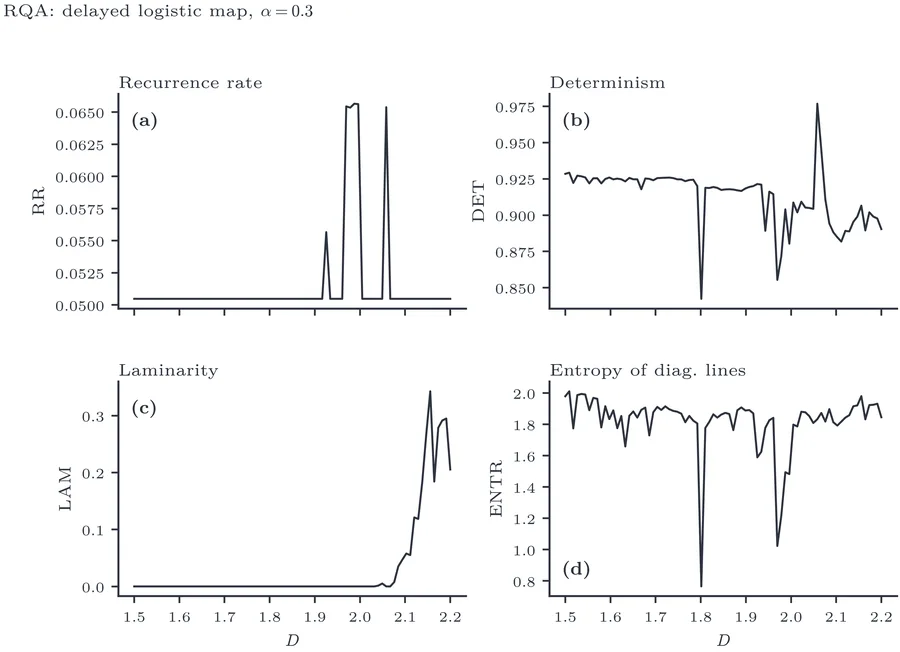
Recurrence plots (Eckmann et al. 1987; Marwan et al. 2007) visualise the times at which a trajectory returns to a previously visited neighbourhood. From the binary recurrence matrix (where is the recurrence threshold), one extracts quantitative measures:
RR (recurrence rate): fraction of recurrent points.
DET (determinism): fraction in diagonal lines ().
LAM (laminarity): fraction in vertical lines ().
ENTR: Shannon entropy of the diagonal line length distribution.
RQA tracks recurrent states and temporal structures: the laminarity measure LAM tracks the fraction of near-recurrent states, while ENTR captures the structural complexity of diagonal recurrence lines. We evaluate these measures on the single-site delayed logistic map benchmark (Section 3.1) rather than across the full CML lattice, avoiding embedding-dimension ambiguities. Figure 29 shows these four measures versus . The transition from torus to chaos manifests as a jump in ENTR and a restructuring of DET and LAM.
How this figure was computed
# Reduced preview (3 D values). Full figure: dynachaos run sec11_diagnostics
# RQA measures (RR, DET, LAM) along the delayed logistic map (alpha=0.3).
import numpy as np

from dynachaos.diagnostics.recurrence import recurrence_matrix, rqa
from dynachaos.maps.primitives import delayed_logistic

alpha = 0.3
for D in (1.6, 1.9, 2.1):
    state = np.array([0.51, 0.49])
    for _ in range(2000):
        state = delayed_logistic(state, alpha, D)
    traj = np.empty((500, 2))
    for i in range(500):
        state = delayed_logistic(state, alpha, D)
        traj[i] = state
    R, _ = recurrence_matrix(traj, percentile=5)
    stats = rqa(R, l_min=2, v_min=2)
    print(f"D={D:.2f}  RR={stats['RR']:.3f}  DET={stats['DET']:.3f}  LAM={stats['LAM']:.3f}")

# Full figure: dynachaos run sec11_diagnostics
6.7 Diagnostic spotlight: the temporal-intermittency taxonomy #
The laminar/burst dichotomy that organises spatiotemporal intermittency has a classical low-dimensional counterpart. Pomeau and Manneville (1980) classified the intermittent routes to chaos by the way a periodic orbit loses stability: Type I through a tangent (saddle–node) bifurcation, Type II through a subcritical Hopf bifurcation, and Type III through a subharmonic (inverse period-doubling) bifurcation. A distinct mechanism, on–off intermittency, arises when an invariant subspace loses transverse stability at a blowout bifurcation (Platt et al. 1993; Heagy et al. 1994). We apply laminar-phase detection and heavy-tail estimators (maximum-likelihood exponent with bootstrap confidence interval and a goodness-of-fit -value) to canonical realisations of each route, as a check that the diagnostics behave correctly where the underlying scaling laws are known.
Type I (Figure 30) is realised by the logistic map just below its period-3 window, where three tangent channels open between the third iterate and the diagonal. The laminar-length distribution follows a power law (, goodness-of-fit ) and the mean laminar length obeys the normal-form scaling ; the Lorenz system at provides a continuous-time exemplar of the same near-diagonal reinjection channel.
Type III (Figure 31) is illustrated through the flip channel of a second-iterate return map, with the reinjection probability density characterised in the formulation of Elaskar et al. (2011). A power-law fit to the laminar distribution gives goodness-of-fit , which rejects a pure power law at the 5% significance level.
Type II (Figure 32) is shown only as a normal-form demonstration: the spiral growth and reinjection of the subcritical-Hopf normal form yield a laminar-length distribution with an exponential (not power-law) envelope, and a power-law fit is rejected (goodness-of-fit ). No clean physical Type II example is included (the p–n diode and the forced jet are the usual citations), so no claim is made beyond the normal form.
On–off intermittency (Figure 33) uses a skew logistic system tuned near its blowout onset, where the transverse Lyapunov exponent crosses zero. The off-time (laminar) distribution has a fitted exponent (95% CI ), with goodness-of-fit , which also rejects a pure power law at the 5% level. The mean off-time follows the expected scaling . The burst-amplitude distribution is not a power law (goodness-of-fit ); we report the rejection and fit nothing else. These temporal routes give the spatiotemporal case a vocabulary, not a decomposition. Each laminar interval in the coupled-map-lattice intermittency of Section 6.2 is, locally in time, a site lingering near a marginally stable state before a burst, and the classical types list the ways such local stability can be lost. No single type accounts for the full lattice dynamics, which couple these local events across space.
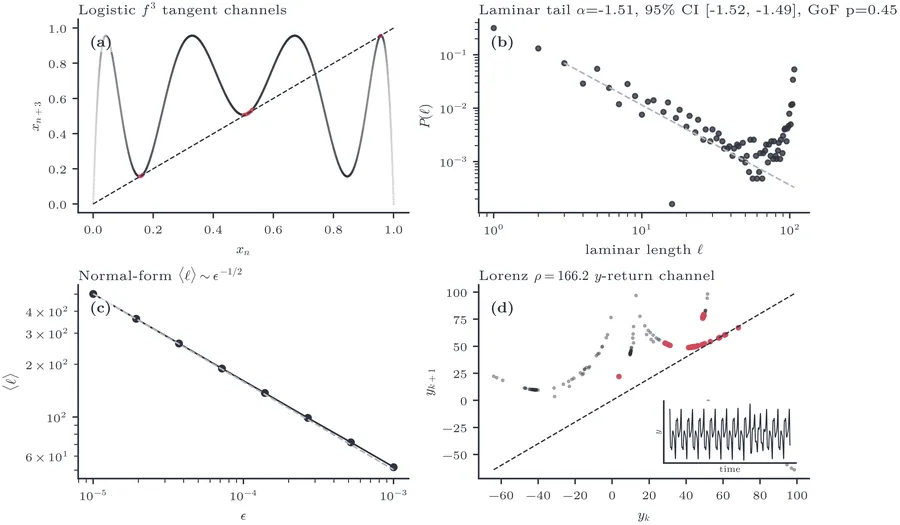
How this figure was computed
# Type-I intermittency: tangent bifurcation and laminar-phase statistics.
# Full figure: dynachaos run sec12_intermittency
from dynachaos.diagnostics.intermittency import detect_laminar_phases
from dynachaos.maps.intermittency import LOGISTIC_TYPE_I_ONSET, logistic_type_i_oracle

series = logistic_type_i_oracle(20_000, x0=0.2, r=LOGISTIC_TYPE_I_ONSET - 1e-4)
_, lengths = detect_laminar_phases(series, method="period", period=3, percentile=70.0)
print(
    f"r_c={LOGISTIC_TYPE_I_ONSET:.4f}  n_laminar_phases={len(lengths)}  "
    f"mean_length={lengths.mean():.2f}"
)
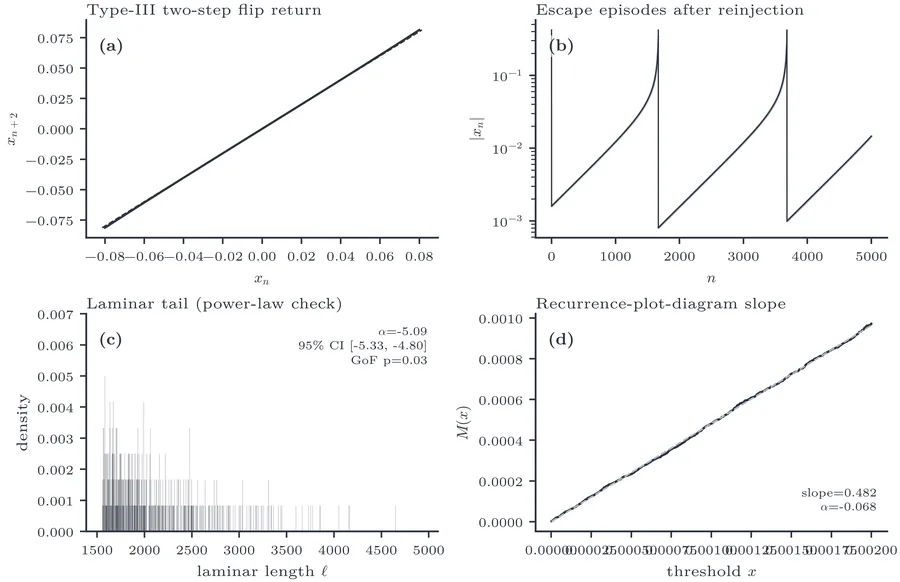
How this figure was computed
# Type-III intermittency (flip bifurcation): escape-episode statistics.
# Full figure: dynachaos run sec12_intermittency
import numpy as np

from dynachaos.maps.intermittency import pm_type_iii_oracle

eps, a, escape_threshold = 2e-3, 1.0, 0.35
for x0 in (2e-6, 2e-4, 2e-3):
    orbit = pm_type_iii_oracle(8000, x0=x0, eps=eps, a=a)
    escaped = np.abs(orbit) >= escape_threshold
    if escaped.any():
        status = f"{int(np.argmax(escaped))} steps before escape"
    else:
        status = f">={len(orbit)} (no escape)"
    print(f"x0={x0:.0e}  laminar_length={status}")
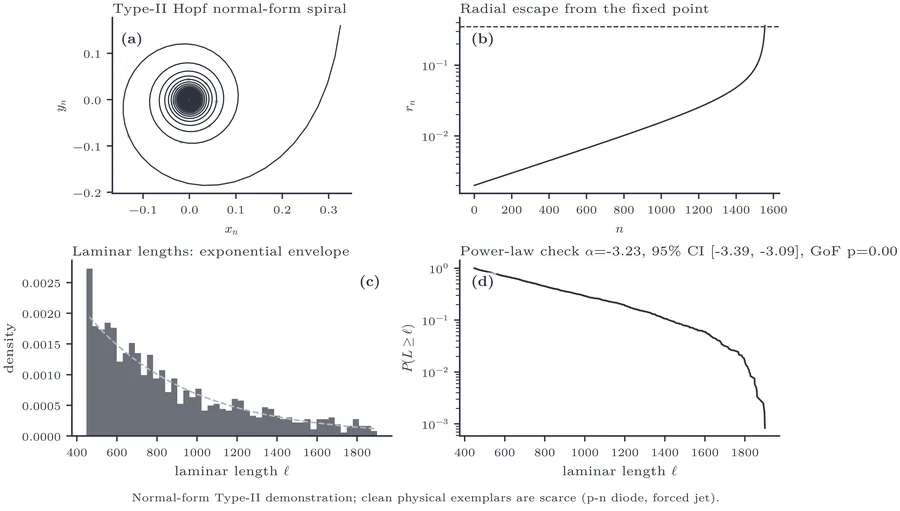
How this figure was computed
# Type-II intermittency (subcritical Hopf): normal-form escape-time computation.
# Full figure: dynachaos run sec12_intermittency
import warnings

import numpy as np

from dynachaos.maps.intermittency import pm_type_ii_oracle

eps, a, theta, escape_threshold = 2e-3, 1.0, 0.17, 0.35
with warnings.catch_warnings():
    warnings.filterwarnings("ignore", category=RuntimeWarning)
    for r0 in (1e-3, 1e-2, 2e-2):
        orbit = pm_type_ii_oracle(2500, x0=r0, y0=0.0, eps=eps, a=a, theta=theta)
        radius = np.linalg.norm(orbit, axis=1)
        escaped = radius >= escape_threshold
        if escaped.any():
            status = f"{int(np.argmax(escaped))} steps before escape"
        else:
            status = f">={len(orbit)} (no escape)"
        print(f"r0={r0:.0e}  laminar_length={status}")
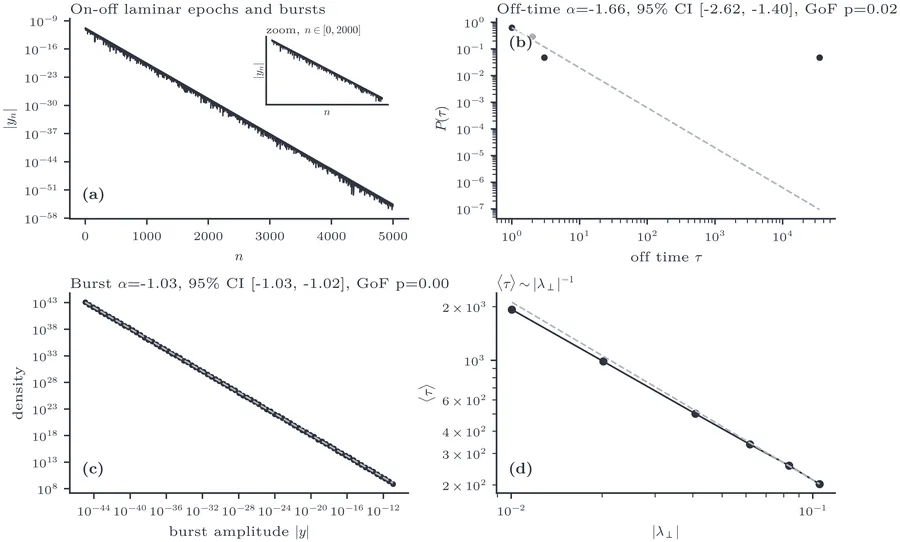
How this figure was computed
# On-off intermittency across blowout onset (lambda_perp crossing zero).
# Full figure: dynachaos run sec12_intermittency
import numpy as np

from dynachaos.maps.intermittency import on_off_skew_logistic_oracle


def mean_run_length(mask):
    lengths, run = [], 0
    for flag in mask:
        if flag:
            run += 1
        elif run > 0:
            lengths.append(run)
            run = 0
    if run > 0:
        lengths.append(run)
    return np.mean(lengths) if lengths else 0.0


for eps in (0.48, 0.50, 0.51):
    skew = on_off_skew_logistic_oracle(20_000, x0=0.217, y0=1e-2, eps=eps)
    y = np.abs(skew[1000:, 1])
    off_mask = y <= np.percentile(y, 90)
    lambda_perp = np.log(2.0 * eps)
    print(
        f"eps={eps:.3f}  lambda_perp={lambda_perp:+.4f}  "
        f"mean_off_run_length={mean_run_length(off_mask):.1f}"
    )
7 Mean-Field Extension: Globally Coupled Maps #
Global all-to-all coupling enables macroscopic collective chaos and spontaneous dynamical clustering, causing mean-field fluctuations to persist in the thermodynamic limit. The globally coupled map (Kaneko 1990b, 1989a) replaces the nearest-neighbour diffusion of the CML with all-to-all coupling, its mean-field limit. With no spatial structure left, what remains is the relation between chaos in each element and order in the whole, and the question Kaneko put to it was whether a system can be chaotic element by element and still fail to self-average. In parallel work on globally coupled limit-cycle oscillators, Nakagawa and Kuramoto (1993) demonstrated that a population of chaotic elements can exhibit low-dimensional collective chaos in its macroscopic order parameter. Pikovsky and Kurths (1994) subsequently examined the statistical properties of globally coupled map ensembles, investigating whether the apparent violation of the law of large numbers persists in the infinite-size limit. Three phenomena emerged that a nearest-neighbour lattice cannot show: dynamical clustering (symmetry breaking among identical elements), a failure of the law of large numbers (the mean field keeps finite fluctuations as ), and collective chaos (the mean field has its own low-dimensional chaotic dynamics). Clustering was developed further in (Kaneko 1990a, 1991, 1992a). We recompute Kaneko’s MSD-versus- plot (Fig. 1 of (Kaneko 1990b)) and add figures of cluster states, of the largest Lyapunov exponent, and a reproduction of the collective Lyapunov exponent of Shibata and Kaneko (1998). Kaneko (1990b) introduced the globally coupled map (GCM):
7.1 Violation of the law of large numbers #
Kaneko’s claim is that collective chaos violates the law of large numbers but not the central limit theorem: approaches Gaussian form, yet its variance stays macroscopic (Kaneko 1990b).
For independent, identically distributed random variables, the variance of the mean decreases as . Kaneko showed that for the GCM at certain parameter values, the mean-square deviation (MSD)
dynachaos run sec10_gcm) at five canonical values of (). Fitting the finite-size scaling yields strictly positive asymptotic saturation intercepts for all five parameters: at , at , at , at , and at (each more than 50 standard errors above zero). Already at the term is no larger than , so over – the variance of the mean field stays finite instead of falling as . This “violation of the law of large numbers” (more precisely, a failure of the usual scaling) shows that the mean field keeps a collective motion of its own (Kaneko 1990b). Whether that motion is low-dimensional chaos is a separate question: for identical elements, Shibata and Kaneko (1998) find that the scale of the mean-field motion does not separate from the microscopic one (control in Figure 38(b)), while with a distributed nonlinearity they find low-dimensional collective chaos. With increasing , the distribution of the mean field (Figure 35) approaches an approximately Gaussian form, yet its variance stops decreasing beyond a crossover size, so the law of large numbers fails while CLT-like Gaussianity can still hold qualitatively (Kaneko 1990b, 1992a).7.2 Collective chaos and cluster states #
The nontrivial mean-field dynamics indicates that the oscillators, although not synchronised, maintain correlations that resist averaging. Kaneko showed that the system self-organises into cluster states: groups of oscillators that share the same trajectory, with the number and sizes of clusters depending on and . These clusters are not imposed by the coupling topology (which is all-to-all and thus featureless) but emerge from the dynamics, a form of dynamical symmetry breaking.
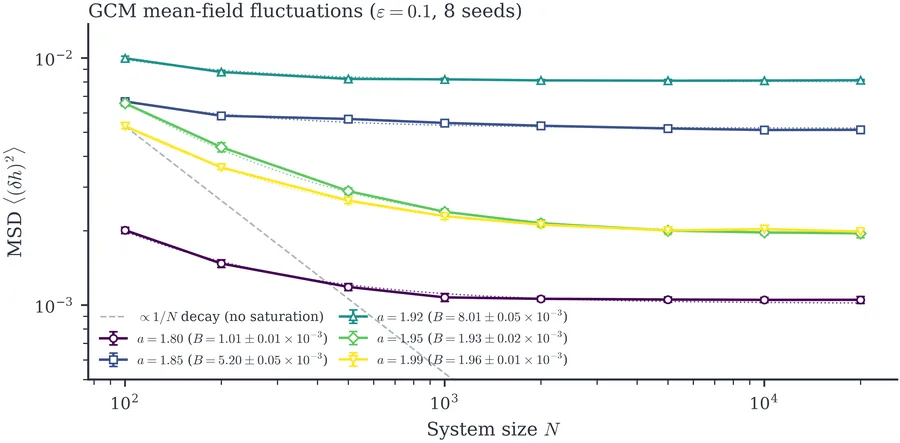
dynachaos run sec10_gcm. Compare with Kaneko (1990b), Fig. 1.How this figure was computed
# Reduced preview (N in 50..5000, a = 1.99, single seed). Full figure: dynachaos run sec10_gcm
# Mean-square deviation (variance) of the mean field h_n of a globally coupled logistic map vs N.
# Full figure averages 8 seeds across 5 a values with saturation fit MSD(N) = A/N + B (B > 0).
from dynachaos.cml.globally_coupled import compute_msd_sweep

result = compute_msd_sweep(
    a_values=(1.99,),
    N_values=(50, 500, 5000),
    n_seeds=1,
    n_transient=300,
    n_sample=400,
    output_path=None,
)
for N, msd in zip(result["N_values"], result["msd_mean"][0], strict=True):
    print(f"N={N:5d}  Var(h)={msd:.3e}")
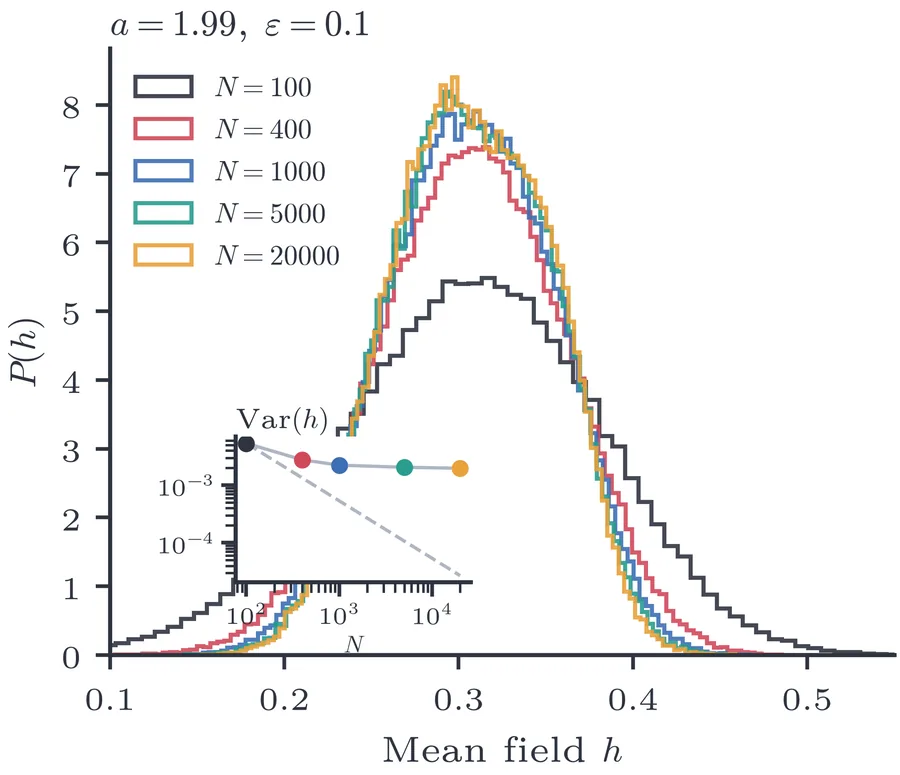
How this figure was computed
# Reduced preview (N in (50, 5000), a=1.99). Full figure: dynachaos run sec10_gcm
# Distribution P(h) of the mean field h_n of a globally coupled logistic map.
import numpy as np

from dynachaos.cml.primitives import gcm_step
from dynachaos.maps.primitives import logistic

a = 1.99
eps = 0.1
rng = np.random.default_rng(42)
for N in (50, 5000):
    x = rng.uniform(-1, 1, N)
    for _ in range(300):
        x = gcm_step(x, a, eps)
    h_series = np.empty(400)
    for t in range(400):
        x = gcm_step(x, a, eps)
        h_series[t] = np.mean(logistic(x, a))
    print(f"N={N:5d}  mean(h)={h_series.mean():.4f}  std(h)={h_series.std():.4f}")

# Full figure: dynachaos run sec10_gcm
7.3 Clustered attractors and switching #
In the GCM, a cluster state is a partition of the sites into groups with nearly identical instantaneous values at a given iterate. The partition is characterised by the cluster multiplicities with . Kaneko (1990a) showed that at moderate coupling (), the GCM spontaneously selects a small number of clusters (–), and that the partition coding provides a discrete “label” for each macroscopic state.
In two-cluster attractors, coded by the populations and of the two clusters, Kaneko found posi-nega switching (Kaneko 1989a): an input on a single site moves it from one cluster to the other, so the system switches among the coded attractors. When is pushed beyond a threshold , the system passes through a chaotic transient and every site changes to and vice versa. Figure 36 visualises the cluster structure as a spacetime diagram after sorting the site values at each time step, so that coherent clusters appear as broad plateaus whose widths encode their populations.
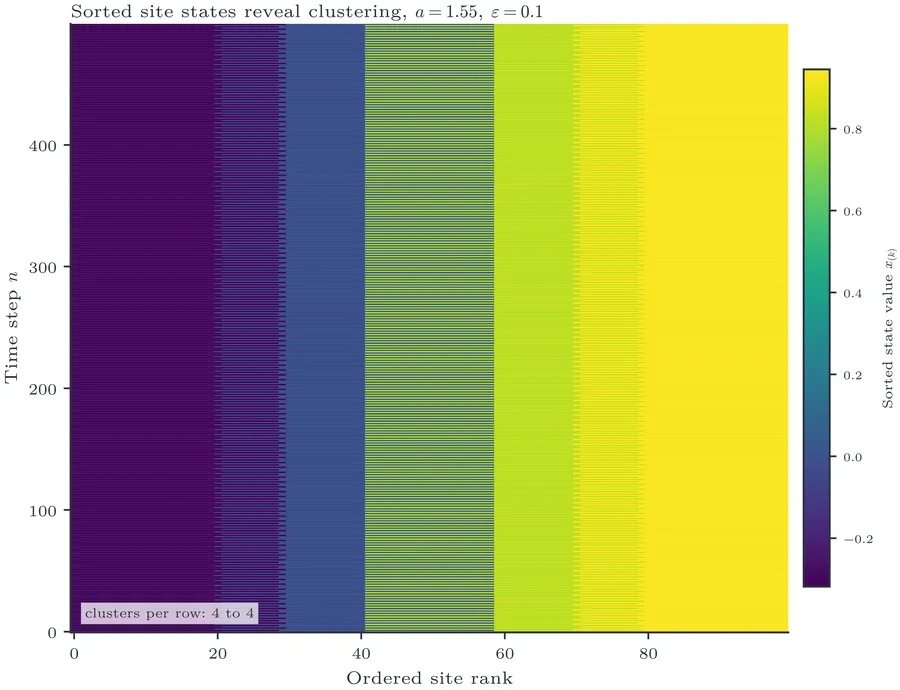
How this figure was computed
# Cluster count of a globally coupled logistic map (a=1.55, N=100) at eps=0.1 and eps=0.3.
# Full figure: dynachaos run sec10_gcm
from dynachaos.cml.gcm_clusters import compute_clusters

for eps in (0.1, 0.3):
    result = compute_clusters(
        a=1.55,
        eps=eps,
        n_sites=100,
        n_transient=2000,
        n_record=10,
        output_path=None,
    )
    n_clusters = len(set(result["cluster_labels"][-1]))
    print(f"eps={eps:.2f}  clusters at final step={n_clusters}")
7.4 Collective degrees of freedom #
Shibata and Kaneko (1998) introduced a collective Lyapunov exponent for the mean field of a GCM whose elements have a distributed nonlinearity. A perturbation of observed at scales above a microscopic scale grows at the rate , which is much smaller than the largest microscopic exponent ; when decreases as , the mean field has its own low-dimensional chaotic dynamics in the limit .
The partially ordered (PO) phase, between full synchronisation and full turbulence, is characterised by clusters that form, merge, and split in a marginally stable regime. Kaneko (1994a) showed that in this regime, information cascades through the cluster hierarchy with marginal stability: the system sits at the edge of a bifurcation, generating long-range temporal correlations. Takeuchi, Ginelli, and Chaté (Takeuchi et al. 2009) later identified collective Lyapunov modes that capture macroscopic fluctuations in large coupled chaotic systems.
Figure 37 shows the largest Lyapunov exponent of the GCM (16) with identical elements at , computed from the tangent map (dynachaos run sec10_gcm). It becomes positive, by more than two standard errors over eight seeds, from and reaches at , with no dependence on between 500 and 2000. This is the exponent of the microscopic chaos. An infinitesimal perturbation of the mean field grows at the same rate, so alone says nothing about collective chaos (Shibata and Kaneko 1998).
Shibata and Kaneko therefore keep the perturbation finite and measure the finite-size Lyapunov exponent (Aurell et al. 1996) of the mean field, , where is the time for to grow from to . The normalised time grows as below and as above it (their Eq. 6). Figure 38 reproduces their chaotic case, , (dynachaos run sec10_gcm). The perturbed copy starts at with uniform in , and is counted from the first step at which , so that the perturbation has aligned with the growing direction. Below the exponent equals (0.41 in (Shibata and Kaneko 1998)). Fits of Eq. 6 for give , , and for , , and (fit errors at most ), against in (Shibata and Kaneko 1998), and decreases as , with at ( in (Shibata and Kaneko 1998)). The values depend on the upper end of the fit range: from to , at lies between 0.020 and 0.026, and the exponent of between and . For identical elements (, ) the curves for and do not separate, as Shibata and Kaneko found: there the scale of the mean-field motion does not separate from the microscopic one.
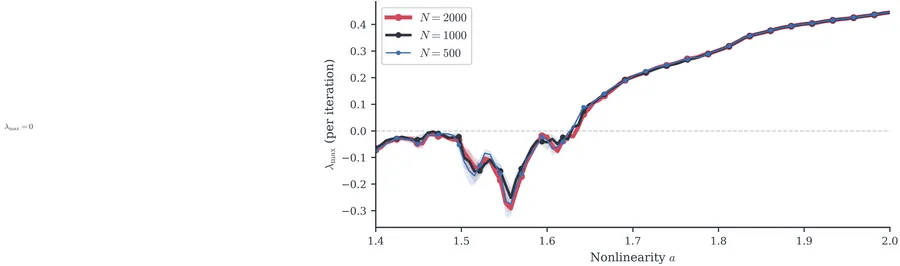
dynachaos run sec10_gcm.How this figure was computed
# Reduced preview (N = 200, 3 a values, 1 seed). Full figure: dynachaos run sec10_gcm
# Largest Lyapunov exponent lambda_max of the identical-element GCM (eps = 0.1) by the tangent map:
# v -> (1 - eps) f'(x) v + eps <f'(x) v>, renormalised every step. This is the microscopic
# (site) exponent, not the collective exponent of the mean field.
# Full figure: 8 seeds for N = 500, 1000, 2000 over a in [1.40, 2.00].
from dynachaos.cml.gcm_lyapunov_max import lyapunov_max

for a in (1.50, 1.80, 1.95):
    lam = lyapunov_max(a, 0.1, 200, n_transient=500, n_measure=2000, seed=42)
    print(f"a={a:.2f}  lambda_max={lam:+.4f}")
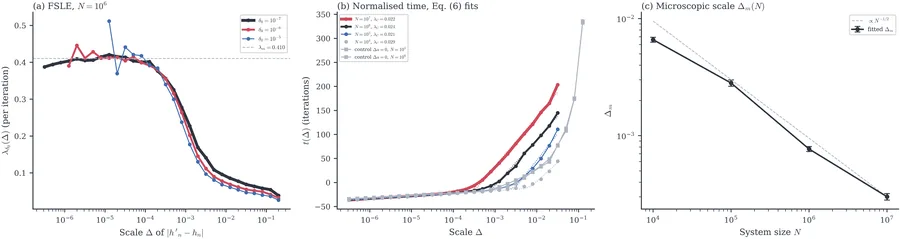
dynachaos run sec10_gcm.How this figure was computed
# Reduced preview (N = 1000, 3 perturbations). Full figure: dynachaos run sec10_gcm
# Finite-size Lyapunov exponent (FSLE) of the mean field of the heterogeneous GCM
# a(i) = 1.9 + 0.05 (2i - N) / (2N), eps = 0.098 (Shibata & Kaneko 1998, Figs. 3-5):
# lambda(Delta) = log(Delta / delta0) / <tau(Delta)>, tau = first time |h' - h| reaches Delta.
# Full figure: N = 1e4, 1e5, 1e6, 100 perturbations; Eq. (6) fits give lambda_C, Delta_m.
# Larger sizes: python -m dynachaos.cml.gcm_collective_fsle --add 10000000
import numpy as np

from dynachaos.cml.gcm_collective_fsle import (
    CHAOS,
    DELTAS,
    a_profile,
    first_passage,
    lambda_m,
    step,
)

N = 1000
delta0 = 1e-7
a = a_profile(CHAOS["a0"], CHAOS["delta_a"], N)
rng = np.random.default_rng(N)
x = rng.uniform(-1.0, 1.0, N)
for _ in range(2000):
    x, _ = step(x, a, CHAOS["eps"])

taus = []
for _ in range(3):
    tau, x = first_passage(x, a, CHAOS["eps"], delta0, rng, 3000)
    taus.append(tau)
mean_tau = np.mean(taus, axis=0)

lam_m = lambda_m(a, CHAOS["eps"], x, n_transient=500, n_measure=2000)
print(f"lambda_m = {lam_m:.3f} (tangent map)")
for D in (1e-5, 1e-4, 1e-3, 1e-2):
    k = int(np.argmin(np.abs(np.log(DELTAS / D))))
    if mean_tau[k] <= 3000:
        print(
            f"Delta={DELTAS[k]:.1e}  lambda(Delta)={np.log(DELTAS[k] / delta0) / mean_tau[k]:.3f}"
        )
8 Discussion #
Kaneko’s papers of 1982–1998 established the vocabulary and the phenomenology of torus dynamics and spatiotemporal chaos. Ordered by the six mechanisms of the Introduction, from phase instability to mean-field coupling, they read as a sequence of steps in complexity instead of a chronology. Recomputing these models reveals both the structural continuity of the transitions and the methodological boundaries of modern diagnostics, such as the behaviour of SALI on dissipative maps, where its decay alone separates a torus from partial locking or chaos but not partial locking from chaos.
This ordering matters because the same operation recurs across different models: add one structural degree of freedom, then ask which invariant object loses stability and which observable records the loss. In the circle map the relevant observable is a rotation number; in torus oscillation and doubling it is the Lyapunov spectrum and the geometry of an invariant circle; in the CML it is the propagation of perturbations through space; in the GCM it is the persistence of mean-field fluctuations as grows. The atlas complements broad CML metric surveys such as Nolan et al. (Nolan et al. 2026), which sample many systems and metrics but do not retrace Kaneko’s sequence of mechanisms and figures.
8.1 Mechanistic interpretation #
The mechanism-based ordering also explains why the same diagnostic cannot carry the whole paper. The appropriate observable is fixed by the invariant object being destabilised. In the phase-locking sections, that object is an invariant circle with a well-defined winding rate, so the rotation number is the natural observable. For torus oscillation and doubling, the change is not only in frequency content but in the stability of transverse directions, which makes the Lyapunov spectrum decisive. The same logic fixes the remaining pairings: basin and order-parameter views for symmetry breaking, where exchange-related attractors coexist; spatial diagnostics for CMLs, where perturbations propagate through laminar and burst regions; and finite-size and mean-field statistics for GCMs, where persistent correlations among nominally identical elements survive averaging.
Higher resolution makes these distinctions visible. Narrow windows resolve locking transitions organised by rational approximants, long trajectories reduce misclassification of weak chaos and nearly neutral tori, and finite-size sweeps test whether collective chaos persists as mean-field averaging becomes more effective. A diagnostic is decisive only when the degree of freedom that goes unstable is one it can see.
8.2 Toric chaos #
Yamagishi and Kaneko (2020) showed that chaos can exist on a high-dimensional torus and not only through its collapse. In systems of globally coupled phase oscillators, the attractor can be a high-dimensional torus (with ) on which the dynamics is chaotic, which they call “toric chaos.” This adds a fate to Kaneko’s list for and beyond: a higher-dimensional torus can carry chaos without collapsing.
The coupled delayed logistic map (Section 5.1) supports three-torus motion that collapses to chaos as increases at fixed coupling (Figure 17). At the transition, two Lyapunov exponents are near zero while one becomes positive. This is the classical torus collapse, not toric chaos in the sense of Yamagishi and Kaneko (2020), which requires the torus to persist as a manifold even while the on-torus dynamics is chaotic.
8.3 Biological relevance #
Kaneko extended the dynamical clustering framework to biological networks. Kaneko (1994b) showed that the partition structure of GCM cluster states provides a natural encoding of cell-type diversity. In coupled maps with growth and death dynamics, clusters of oscillators that share a common time trace can then be reinterpreted as cell types, with cluster formation playing the role of cell differentiation (Kaneko 1997a). Ecological applications of coupled logistic maps appeared early (Satoh and Aihara 1990; Satoh 1991). In a recent preprint, Shimada and Kaneko (2026) continue this direction by connecting high-dimensional chaos and intermittent switching to coexistence in cross-feeding microbial-community models. In these models the macroscopic state is carried by partitions that form dynamically, not by fixed species labels or imposed network modules, which is why the mean-field and clustering mechanisms are still in use.
8.4 Diagnostic synergies #
The four modern diagnostics distributed across the preceding sections provide complementary views of Kaneko’s transitions:
The 0-1 test (Section 4) is the most practical for binary classification (chaos vs. regular) from scalar data because it does not require equations or tangent maps.
SALI (Section 3) requires the linearised flow; in the dissipative maps examined here, phase-space contraction aligns deviation vectors, so SALI stays bounded on a torus and decays on partial locking and on chaos, and its decay alone does not separate those two (cf. Moges et al. (Moges et al. 2025)); the decay rate does.
Permutation entropy (Section 5) works from the ordinal patterns of a scalar observable alone, tracking regular windows and chaotic bands without a Jacobian.
RQA (Section 6) responds to laminar residence times and repeated local patterns; we test it here on the single-site torus-to-chaos transition.
These diagnostics are not interchangeable. Each responds to a different way in which order is lost, and the limit of SALI on the dissipative maps above is one reason a single diagnostic cannot carry the paper.
8.5 Computational limitations: then and now #
Kaneko’s original parameter scans typically used points with iterations per point. Our scans use from 500 (Figure 17) to 200 000 (Figure 3) parameter values (Table B1). This increase matters because several transitions are organised by narrow windows, thin strands, or fractal boundaries; at high resolution, the tongue boundaries, period-adding plateaus, and basin stripes can be read directly off the plot.
8.6 What persisted after the 1990s #
Three later lines of work extended the framework beyond spatiotemporal chaos. First, the collective chaos discovered in the GCM led to a systematic study of Milnor attractor networks (Kaneko 1997b, 1998): in systems with many coexisting attractors, noise-induced transitions are governed by the Milnor attractor structure and not by basin volume. Second, chaotic itinerancy, a slow, directed wandering among partially stable attractor ruins proposed by Tsuda (1991) and developed with Kaneko (1992b, 1995; Kaneko and Tsuda 2001), became an organising idea for high-dimensional chaos. Third, dynamic clustering was reinterpreted as a model of cell differentiation: coupled maps with growth and death dynamics produce spontaneous diversification of cell types (Kaneko 1997a). Separately, renormalisation-group analysis clarified the scaling structure of torus doubling and strange nonchaotic attractors (Kuznetsov et al. 1995; Kuznetsov et al. 1998; Nishikawa and Kaneko 1996).
8.7 Open questions #
Several questions raised by Kaneko’s work remain open:
Is the torus-doubling exponent truly universal? Kaneko’s numerical evidence is suggestive but not definitive. Partial renormalisation-group results exist for the torus-doubling terminal point and for quasi-periodically forced one-dimensional maps (Kuznetsov et al. 1998; Jorba et al. 2015, 2016), but a complete renormalisation-group analysis analogous to Feigenbaum’s for period doubling has not been achieved. A fixed point of the doubling operator, with its eigenvalue compared against the fitted value, would settle it.
What is the complete classification of fates? Kaneko identified locking, fractalization, and chaos, but the measure-theoretic structure of the phase diagram (which fates are generic, which are exceptional) is not fully understood; the exponential rarity of high-dimensional tori found by Yamagishi and Kaneko (2020) is partial progress. A measure of the locked, fractalized, and chaotic regions as the grid is refined, with a convergence test, would say which fates are generic.
Can the directed percolation universality of STI be proven rigorously? Critical exponents of directed percolation have been measured in coupled circle-map lattices (Janaki et al. 2003; Jabeen and Gupte 2005, 2006) and in experiment (Rupp et al. 2003). What remains open is a rigorous mathematical proof, and whether the Model-A lattice studied here belongs to the DP universality class. Testing the DP class for this lattice requires systematic finite-size scaling of the turbulent fraction across system sizes from 256 to 4096 sites at the critical coupling , comparing measured exponents against DP bounds.
Does chaos sustain biological diversity? Kaneko’s clustering models of cell differentiation (Kaneko 1994b, 1997a) and ecological applications (Satoh and Aihara 1990; Satoh 1991) connect the two fields. Shimada and Kaneko in a recent preprint (Shimada and Kaneko 2026) ask a concrete form of the question: whether the number of coexisting species exceeds the competitive-exclusion bound in the high-dimensional chaotic regime. The test is a count of coexisting species against that bound in the same model with and without chaos.
9 Conclusions #
Kaneko’s papers of 1982–1998 have been recomputed and arranged by mechanism. Each of the six chapters adds one structural degree of freedom to the one before.
Organising the work this way makes a recurring construction easy to see: a low-dimensional invariant object is destabilised, then a new degree of freedom (amplitude, symmetry, spatial propagation, or mean-field correlation) becomes dynamically active. This pattern was already present in Kaneko’s original papers; recomputing the figures at higher resolution and viewing the models side by side brings it into a single view.
The principal contributions of this review are:
A reproducible figure-to-command atlas recomputing Kaneko’s 1982–1998 models across six physical mechanisms from public open-source code (Table 2).
Denser parameter scans (up to values) showing the tongue boundaries, period-adding plateaus, and basin stripes at a resolution where they can be read off the plot.
Side-by-side evaluation of modern diagnostics (the 0-1 test, permutation entropy, and recurrence quantification analysis) on canonical benchmark models, identifying their operating domains and documenting that on a dissipative map SALI stays bounded on a torus and decays on partial locking and on chaos, where only its decay rate separates the two.
An open, scripted analysis package (
dynachaos) providing automated command-line pipelines for every figure.
The atlas is a reference point: old and new computations of the same models can be compared directly. It establishes no new scaling law, does not replace finite-size scaling for STI, and does not turn the diagnostic spotlights into validated automatic classifiers. Next steps are a controlled finite-size-scaling study of the STI examples, an uncertainty estimate for the torus-doubling exponent, and a comparison between the spotlights used here and larger metric suites for CMLs.
The dynachaos analysis codebase and figure artifacts for this paper are available at https://github.com/openfluids/dynachaos (Apache-2.0); the commit that produced each figure is recorded in the repository history. Reproduction uses published dynachaos entry points rather than private scripts: section figures are regenerated with dynachaos run <section_id> or dynachaos run all, while external scalar/reduced signals are analysed with dynachaos analyze <config.jsonc>. The documented example command dynachaos analyze workflow_fixture.jsonc reads the bundled fixture config and writes workflow_output/results.json plus metadata and summary files; local long-signal analyses follow the same config-to-results pathway.
A Equation Provenance #
Table A1 maps each numbered model equation in this paper to its original source. Equations marked with use notation or functional form that differs from the original; the body text explains the correspondence.
| This paper | Map name | Original reference | Original location |
|---|---|---|---|
| Eq. (1) | Circle map | Kaneko 1982, PTP 68 (Kaneko 1982) | Eq. (1) |
| Eq. (2) | Delayed logistic | Kaneko 1984, PTP 72 (Kaneko 1984c) | Eq. (2.1) |
| Eq. (4) | Map (I) | Kaneko 1983, PTP 69 (Kaneko 1983a) | Map (I) |
| Eq. (5) | Map (IV) | Kaneko 1983, PTP 69 (Kaneko 1983a) | Map (IV) |
| Eq. (8) | Coupled logistic | Kaneko 1983, PTP 69 (Kaneko 1983c) | Eq. (1.1) |
| Eq. (10) | Coupled delayed | Kaneko 1984, PTP 71 (Kaneko 1984a) | Eq. (2.2) |
| Eq. (11) | Modulated circle | Kaneko 1984, PTP 71 (Kaneko 1984a) | Sec. 3 |
| Eq. (13) | CML | Kaneko 1985, PTP 74 (Kaneko 1985) | Eq. (1) |
| Eq. (16) | GCM | Kaneko 1990, PRL 65 (Kaneko 1990b) | Eq. (1) |
Maps (I) and (IV) use Kaneko’s quadratic form . The coupled logistic map in Eq. (8) uses linear diffusive coupling on state variables, whereas Kaneko 1983 (Kaneko 1983c) formulated the coupling on function values . The coupled delayed logistic map in Eq. (10) uses the quadratic form rather than . The modulated circle map uses Kaneko’s simplified form (Eq. 3.1 of (Kaneko 1984a)) with as a pure rigid rotation at the golden-mean inverse .
B Reproduction Index #
Reproduction scripts are implemented as dynachaos modules and can be run via dynachaos run <section_id> or python -m dynachaos.<module>. For config-driven diagnostics, the traceable command form is dynachaos analyze <config.jsonc>, which writes a named results.json alongside metadata and a summary in the configured output directory.
Table B1 maps each reproduced figure to its original source, key parameters, and the generating script.
Figure numbers on this page are the manuscript's own, so a number cited from here means the same figure in the paper.
| Figure | Type | Source | Parameters | Script |
|---|---|---|---|---|
| Fig. 1 | New | Conceptual roadmap | Six-stage mechanism progression | main.tex |
| Fig. 2 | Reproduction | (Arnol’d 1961; Kaneko 1982) | grid in | arnold_tongues.py |
| Fig. 3 | Reproduction | (Kaneko 1982), Fig. 1 | , pts | circle_map.py |
| Fig. 4 | Reproduction | (Kaneko 1982, 1983b) | , pts, Farey subwindows | circle_map.py |
| Fig. 5 | Reproduction | (Kaneko 1984c), Fig. 1 | , 12 values, pts/panel | delayed_logistic.py |
| Fig. 6 | Reproduction | (Kaneko 1984c) | , 8 values in | delayed_logistic.py |
| Fig. 7 | Reproduction | (Kaneko 1984c), Fig. 2 | , 2000 values | delayed_logistic.py |
| Fig. 8 | Reproduction | (Kaneko 1983a), Fig. 2 | , 3 doubling states | torus_doubling.py |
| Fig. 9 | Reproduction | (Kaneko 1983a), Fig. 7 | , 1000 values | torus_doubling.py |
| Fig. 10 | Adaptation | (Kaneko 1984b), Fig. 1 | , 6 values, autonomous map | fractalization.py |
| Fig. 11 | New | (Grassberger and Procaccia 1983) | , 101 values, pts/traj | fractalization.py |
| Fig. 12 | New | (Skokos 2001; Skokos et al. 2007) | , , , , , , iterates, 3 seeds | dynachaos run sec11_diagnostics |
| Fig. 13 | Adaptation | (Kaneko 1983c), Fig. 1 | grid, and fields | coupled_logistic.py |
| Fig. 14 | Reproduction | (Kaneko 1983c), Fig. 2 | , 6 values on branch | coupled_logistic.py |
| Fig. 15 | Reproduction | (Kaneko 1983c; Takesue and Kaneko 1984) | , , grid | coupled_logistic.py |
| Fig. 16 | New | (Gottwald and Melbourne 2004, 2009) | 500 values, 5000 pts, | compare_all.py |
| Fig. 17 | Reproduction | (Kaneko 1984a), Fig. 2 | , 3 values, 500 pts | coupled_delayed.py |
| Fig. 18 | Reproduction | (Kaneko 1984a), Fig. 3 | , , 6 values | coupled_delayed.py |
| Fig. 19 | Reproduction | (Kaneko 1984a), Fig. 5 | , , pts | modulated_circle.py |
| Fig. 20 | Reproduction | (Kaneko 1984a) | pts, 2 zoom windows | modulated_circle.py |
| Fig. 21 | New | (Bandt and Pompe 2002) | , 500 and 200 values | compare_all.py |
| Fig. 22 | New | (Rosso et al. 2007) | , plane | compare_all.py |
| Fig. 23 | Reproduction | (Kaneko 1985), Figs. 2–4 | , 500 steps, models (A), (B), (C) | spatiotemporal.py |
| Fig. 24 | New | STI characterisation | Model-A, , display | sti_spine_figure.py |
| Fig. 25 | Reproduction | (Kaneko 1989b), Fig. 1 | grid, , spatial activity map | pattern_dynamics.py |
| Fig. 26 | Reproduction | (Kaneko 1989b) | , 5 values, , 12 frames | pattern_dynamics.py |
| Fig. 27 | Reproduction | (Kaneko 1986b; Deissler and Kaneko 1987) | , , 3 values | comoving_figure.py |
| Fig. 28 | Reproduction | (Kaneko 1989d) | , 4 values, | correlation_figure.py |
| Fig. 29 | New | (Marwan et al. 2007) | , 80 values, single-site RQA | compare_all.py |
| Fig. 30 | New | (Pomeau and Manneville 1980) | Logistic tangent channel, Lorenz | intermittency_figure.py |
| Fig. 31 | New | (Elaskar et al. 2011) | 2-step flip return map, RPD | type_iii_intermittency_figure.py |
| Fig. 32 | New | Normal form | Subcritical Hopf normal form | type_ii_intermittency_figure.py |
| Fig. 33 | New | (Platt et al. 1993; Heagy et al. 1994) | Skew logistic near blowout onset | on_off_intermittency_figure.py |
| Fig. 34 | Reproduction | (Kaneko 1990b), Fig. 1 | –, , 5 values | globally_coupled.py |
| Fig. 35 | Reproduction | (Kaneko 1990b), Fig. 2 | , , 4 sizes | globally_coupled.py |
| Fig. 36 | Reproduction | (Kaneko 1990a) | , , , sorted rank | gcm_clusters.py |
| Fig. 37 | New | (Kaneko 1990b) | , –, 8 seeds, 100 values | gcm_lyapunov_max.py |
| Fig. 38 | Reproduction | (Shibata and Kaneko 1998), Figs. 3–5 | , , , – | gcm_collective_fsle.py |
C Assumptions and Validity Checklist #
Discrete-time maps: all models are nondimensional iterated maps; “time” is iteration count .
Rotation numbers: computed via the lift (unwrapped phase); near-critical convergence is verified by doubling the averaging length.
Lyapunov spectra: computed via QR/Gram–Schmidt re-orthonormalization after a discarded transient; reported curves are stable under doubling the averaging length.
CML boundary conditions: periodic in space unless stated; diagnostics sampling along a ray (e.g. ) use windows short enough to avoid wrap-around artifacts (see Sec. 6.4).
Fractal dimension estimates: correlation dimension depends on finite sampling ( points), temporal correlations (mitigated by the Theiler window (Theiler 1986)), and scaling-region selection; the fit uncertainty on is reported in Figure 11.
Universality-class language (e.g. “DP-like”): treated as conjectural unless supported by finite-size scaling with uncertainty estimates.
Acknowledgment #
We thank Kunihiko Kaneko, whose papers this work recomputes.
How to cite
To cite this atlas or the recomputed results:
@misc{frantz2026dynachaos,
  title        = {From Locking to Collective Chaos: A Reproducible Review of Kaneko's Circle Maps, Torus Instabilities, Coupled Map Lattices and Globally Coupled Maps},
  author       = {Frantz, Ricardo},
  year         = {2026},
  howpublished = {\url{https://openfluids.github.io/dynachaos/}},
  note         = {dynachaos version 0.4.1, 2026-10-17. Preprint, not peer reviewed}
}